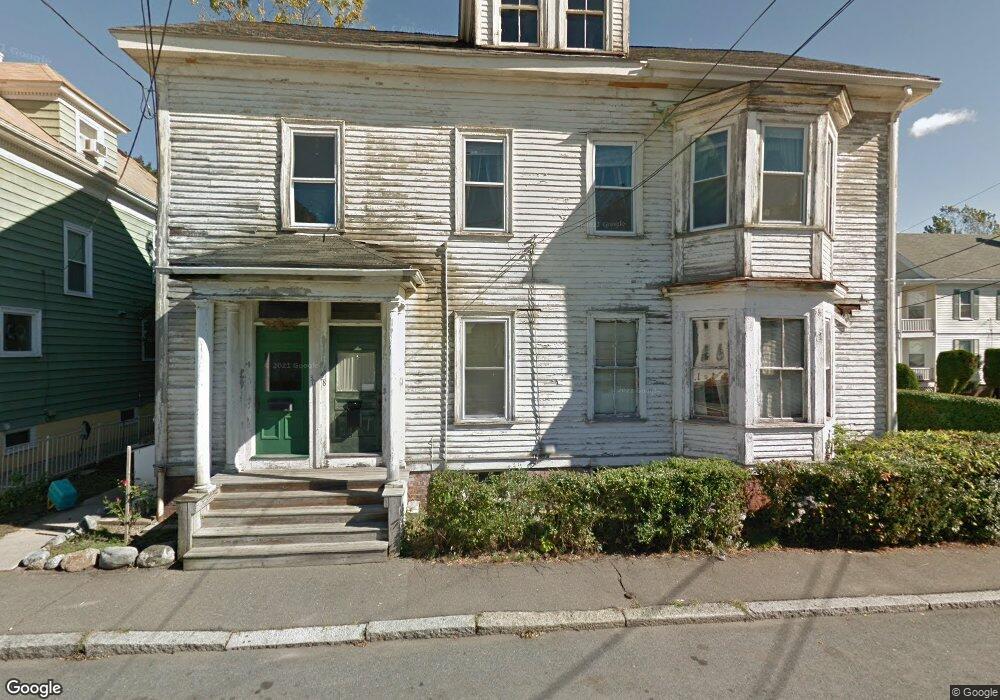
28 Barr St Unit 30 Salem, MA 01970
North Salem NeighborhoodEstimated Value: $752,198 - $1,243,000
6
Beds
2
Baths
4,163
Sq Ft
$222/Sq Ft
Est. Value
About This Home
This home is located at 28 Barr St Unit 30, Salem, MA 01970 and is currently estimated at $925,050, approximately $222 per square foot. 28 Barr St Unit 30 is a home located in Essex County with nearby schools including Bates Elementary School, Saltonstall School, and Carlton Elementary School.
Ownership History
Date
Name
Owned For
Owner Type
Purchase Details
Closed on
May 1, 2025
Sold by
Gray Leila R
Bought by
Caskey Barr Street T and Caskey C
Current Estimated Value
Purchase Details
Closed on
Apr 26, 2024
Sold by
Caskey Philip H
Bought by
Caskey Barr Street T and Caskey C
Purchase Details
Closed on
Aug 26, 2014
Sold by
Gray Leila R
Bought by
Caskey Philip H
Create a Home Valuation Report for This Property
The Home Valuation Report is an in-depth analysis detailing your home's value as well as a comparison with similar homes in the area
Home Values in the Area
Average Home Value in this Area
Purchase History
| Date | Buyer | Sale Price | Title Company |
|---|---|---|---|
| Caskey Barr Street T | -- | None Available | |
| Caskey Barr Street T | -- | None Available | |
| Caskey Barr Street T | -- | None Available | |
| Caskey Barr Street T | -- | None Available | |
| Caskey Barr Street T | -- | None Available | |
| Caskey Barr Street T | -- | None Available | |
| Caskey Barr Street T | -- | None Available | |
| Caskey Philip H | -- | -- | |
| Caskey Philip H | -- | -- |
Source: Public Records
Tax History Compared to Growth
Tax History
| Year | Tax Paid | Tax Assessment Tax Assessment Total Assessment is a certain percentage of the fair market value that is determined by local assessors to be the total taxable value of land and additions on the property. | Land | Improvement |
|---|---|---|---|---|
| 2025 | $7,492 | $660,700 | $216,600 | $444,100 |
| 2024 | $6,878 | $591,900 | $205,800 | $386,100 |
| 2023 | $6,510 | $520,400 | $190,000 | $330,400 |
| 2022 | $7,012 | $529,200 | $183,700 | $345,500 |
| 2021 | $6,610 | $479,000 | $171,000 | $308,000 |
| 2020 | $6,747 | $466,900 | $161,500 | $305,400 |
| 2019 | $6,653 | $440,600 | $153,300 | $287,300 |
| 2018 | $6,103 | $396,800 | $145,700 | $251,100 |
| 2017 | $5,638 | $355,500 | $122,900 | $232,600 |
| 2016 | $5,481 | $349,800 | $117,200 | $232,600 |
| 2015 | $5,309 | $323,500 | $107,700 | $215,800 |
Source: Public Records
Map
Nearby Homes
- 112 North St
- 8 Upham St
- 3 S Mason St
- 27 Appleton St
- 18 Franklin St Unit 303
- 36 Irving St Unit B
- 78 Federal St
- 41 Dearborn St
- 97 Mason St Unit 2
- 5 Larchmont Rd Unit 3
- 19 Cushing St
- 47 Federal St
- 145 Federal St Unit 3
- 304 Essex St Unit 1
- 15 Lynde St Unit 26
- 35 Flint St Unit 209
- 35 Flint St Unit 106
- 289 Essex St Unit 307
- 0 Lot 41 Map 10 Unit 73335079
- 0 Lot 61 Map 10 Unit 73335091