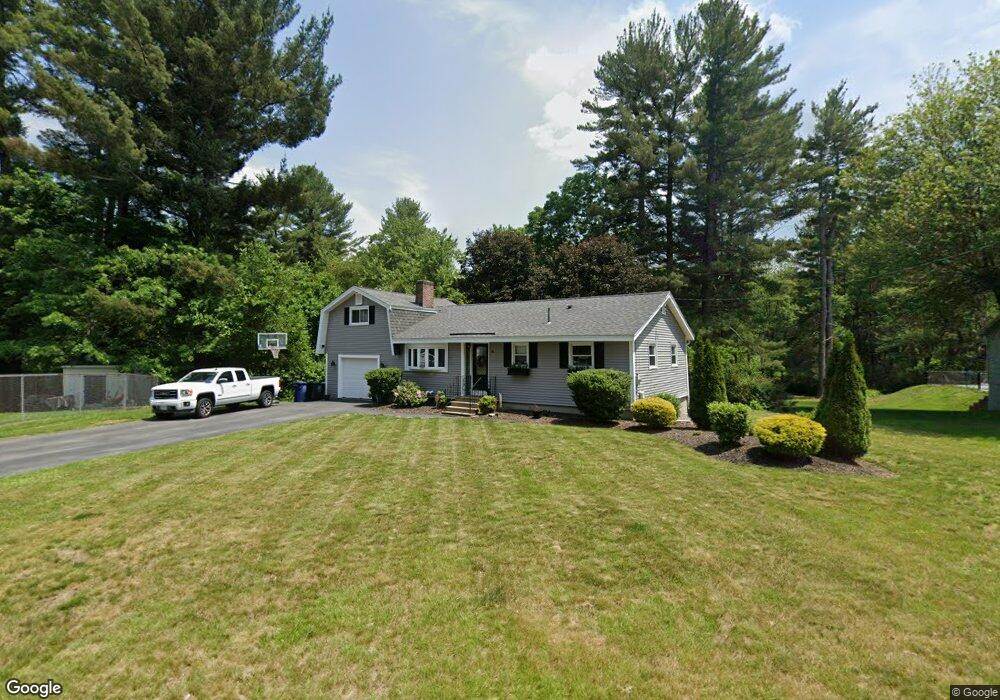
28 Beaver Brook Ln Dracut, MA 01826
Estimated Value: $560,000 - $705,000
3
Beds
1
Bath
1,172
Sq Ft
$520/Sq Ft
Est. Value
About This Home
This home is located at 28 Beaver Brook Ln, Dracut, MA 01826 and is currently estimated at $608,889, approximately $519 per square foot. 28 Beaver Brook Ln is a home located in Middlesex County with nearby schools including Brookside Elementary School, Richardson Middle School, and Dracut Senior High School.
Ownership History
Date
Name
Owned For
Owner Type
Purchase Details
Closed on
Jun 22, 2017
Sold by
Southern End Realty Ll
Bought by
Travers Susan
Current Estimated Value
Home Financials for this Owner
Home Financials are based on the most recent Mortgage that was taken out on this home.
Original Mortgage
$347,888
Outstanding Balance
$289,608
Interest Rate
4.05%
Mortgage Type
FHA
Estimated Equity
$319,281
Purchase Details
Closed on
Nov 21, 2016
Sold by
Gorman Frank
Bought by
Southern End Realty Ll
Purchase Details
Closed on
Aug 31, 2016
Sold by
Etheridge Bruce A
Bought by
Wells Fargo Bank Na Tr
Purchase Details
Closed on
Sep 2, 1997
Sold by
Hypo Realty Inc
Bought by
Etheridge Bruce Aa and Etheridge Wendy L
Home Financials for this Owner
Home Financials are based on the most recent Mortgage that was taken out on this home.
Original Mortgage
$84,000
Interest Rate
7.41%
Mortgage Type
Purchase Money Mortgage
Purchase Details
Closed on
Oct 29, 1996
Sold by
Sands Paul J
Bought by
Hypo Realty Inc
Create a Home Valuation Report for This Property
The Home Valuation Report is an in-depth analysis detailing your home's value as well as a comparison with similar homes in the area
Home Values in the Area
Average Home Value in this Area
Purchase History
| Date | Buyer | Sale Price | Title Company |
|---|---|---|---|
| Travers Susan | $359,900 | -- | |
| Southern End Realty Ll | -- | -- | |
| Wells Fargo Bank Na Tr | $190,000 | -- | |
| Etheridge Bruce Aa | $105,000 | -- | |
| Hypo Realty Inc | $58,000 | -- |
Source: Public Records
Mortgage History
| Date | Status | Borrower | Loan Amount |
|---|---|---|---|
| Open | Travers Susan | $347,888 | |
| Previous Owner | Hypo Realty Inc | $207,000 | |
| Previous Owner | Hypo Realty Inc | $160,000 | |
| Previous Owner | Hypo Realty Inc | $84,000 |
Source: Public Records
Tax History
| Year | Tax Paid | Tax Assessment Tax Assessment Total Assessment is a certain percentage of the fair market value that is determined by local assessors to be the total taxable value of land and additions on the property. | Land | Improvement |
|---|---|---|---|---|
| 2025 | $5,508 | $544,300 | $200,500 | $343,800 |
| 2024 | $5,493 | $525,600 | $190,900 | $334,700 |
| 2023 | $5,264 | $454,600 | $166,000 | $288,600 |
| 2022 | $5,315 | $432,500 | $150,900 | $281,600 |
| 2021 | $5,136 | $394,800 | $137,100 | $257,700 |
| 2020 | $4,918 | $368,400 | $133,100 | $235,300 |
| 2019 | $4,813 | $350,000 | $126,700 | $223,300 |
| 2018 | $4,200 | $297,000 | $126,700 | $170,300 |
| 2017 | $3,486 | $297,000 | $126,700 | $170,300 |
| 2016 | $3,348 | $225,600 | $121,800 | $103,800 |
| 2015 | $3,253 | $217,900 | $121,800 | $96,100 |
| 2014 | $3,046 | $210,200 | $121,800 | $88,400 |
Source: Public Records
Map
Nearby Homes
- 17 Spare St
- 1905 Lakeview Ave
- 60 Robert St
- 29 Mill St Unit B
- 53 Vinal St
- 13 Dallas Dr Unit 305
- 13 Dallas Dr Unit 107
- 83 Turgeon Ave
- 9 Cornstalk Ln
- 154 New Boston Rd
- 43 & 53 5th St
- 74 Tennis Plaza Rd Unit 34
- 94 Tennis Plaza Rd Unit 10
- 979 Hildreth St
- 42 Frederick St Unit 9
- 91 Frederick St Unit 77
- 70 Faith Ave
- 4 Wilshire Ln Unit 4
- 4 Wilshire Ln
- 6 Wilshire Ln Unit 6
- 20 Beaver Brook Ln
- 36 Beaver Brook Ln
- 33 Beaver Brook Ln
- 12 Beaver Brook Ln
- 15 Beaver Brook Ln
- 121 Pine Valley Dr
- 42 Beaver Brook Ln
- 47 Beaver Brook Ln
- 4 Beaver Brook Ln
- 32 Beaver Brook St
- 3 Beaver Brook Ln
- 122 Pine Valley Dr
- 111 Pine Valley Dr
- 50 Beaver Brook Ln
- 57 Beaver Brook Ln
- 116 Pine Valley Dr
- 63 Oxford Rd
- 58 Beaver Brook Ln
- 149 Turtle Hill Rd
- 38 Hillcrest Ave
Your Personal Tour Guide
Ask me questions while you tour the home.