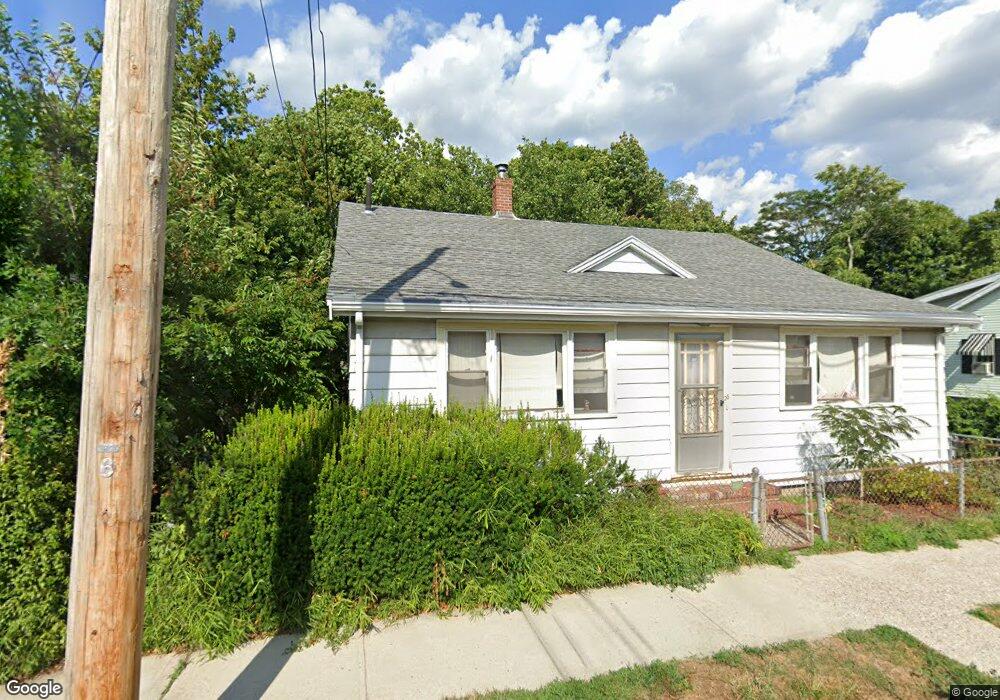
28 Belmont St Quincy, MA 02171
Montclair NeighborhoodEstimated Value: $543,000 - $663,000
2
Beds
1
Bath
1,024
Sq Ft
$596/Sq Ft
Est. Value
About This Home
This home is located at 28 Belmont St, Quincy, MA 02171 and is currently estimated at $610,131, approximately $595 per square foot. 28 Belmont St is a home located in Norfolk County with nearby schools including Montclair Elementary School, Atlantic Middle School, and North Quincy High School.
Ownership History
Date
Name
Owned For
Owner Type
Purchase Details
Closed on
Feb 15, 2017
Sold by
Chuen-Cheung Kam
Bought by
Leong-Cheung James T
Current Estimated Value
Purchase Details
Closed on
Feb 8, 1989
Sold by
King Extx Saralee
Bought by
Cheung Kam C
Home Financials for this Owner
Home Financials are based on the most recent Mortgage that was taken out on this home.
Original Mortgage
$110,000
Interest Rate
10.73%
Mortgage Type
Purchase Money Mortgage
Create a Home Valuation Report for This Property
The Home Valuation Report is an in-depth analysis detailing your home's value as well as a comparison with similar homes in the area
Home Values in the Area
Average Home Value in this Area
Purchase History
| Date | Buyer | Sale Price | Title Company |
|---|---|---|---|
| Leong-Cheung James T | -- | -- | |
| Cheung Kam C | $137,000 | -- |
Source: Public Records
Mortgage History
| Date | Status | Borrower | Loan Amount |
|---|---|---|---|
| Previous Owner | Cheung Kam C | $100,000 | |
| Previous Owner | Cheung Kam C | $110,000 |
Source: Public Records
Tax History Compared to Growth
Tax History
| Year | Tax Paid | Tax Assessment Tax Assessment Total Assessment is a certain percentage of the fair market value that is determined by local assessors to be the total taxable value of land and additions on the property. | Land | Improvement |
|---|---|---|---|---|
| 2025 | $6,081 | $527,400 | $338,800 | $188,600 |
| 2024 | $6,102 | $541,400 | $338,800 | $202,600 |
| 2023 | $5,741 | $511,700 | $322,700 | $189,000 |
| 2022 | $5,510 | $459,900 | $280,600 | $179,300 |
| 2021 | $5,337 | $439,600 | $267,300 | $172,300 |
| 2020 | $5,362 | $431,400 | $267,300 | $164,100 |
| 2019 | $4,945 | $394,000 | $249,700 | $144,300 |
| 2018 | $4,929 | $369,500 | $231,300 | $138,200 |
| 2017 | $4,771 | $336,700 | $220,200 | $116,500 |
| 2016 | $4,312 | $300,300 | $191,500 | $108,800 |
| 2015 | $3,996 | $273,700 | $174,100 | $99,600 |
| 2014 | $3,757 | $252,800 | $165,800 | $87,000 |
Source: Public Records
Map
Nearby Homes
- 115 W Squantum St Unit 907
- 115 W Squantum St Unit 810
- 17 Holmes St Unit 2
- 17 Holmes St Unit 4
- 143 Arlington St
- 65 Barham Ave
- 250 Fayette St
- 129-131 Pine St
- 169 Pine St
- 51 Denmark Ave
- 26 Berlin Ave
- 85 E Squantum St Unit 10
- 171 Milton St
- 11 Earle St
- 45 Marion St
- 121 Hillside Ave
- 11 Rockwell Ave
- 18 Eaton St
- 60 Newbury St Unit 10
- 101 Beach St
- 24 Belmont St
- 32 Belmont St
- 120 Holbrook Rd
- 23 Belmont St
- 31 Belmont St
- 38 Belmont St
- 19 Belmont St
- 132 Holbrook Rd
- 43 Elliot Ave
- 40 Belmont St
- 38 Elliot Ave
- 136 Holbrook Rd
- 42 Belmont St
- 47 Elliot Ave Unit 2 left
- 47 Elliot Ave Unit 2L
- 47 Elliot Ave Unit 1
- 47 Elliot Ave
- 15 Belmont St
- 42 Elliot Ave
- 13 Belmont St