Estimated Value: $284,049 - $337,000
--
Bed
--
Bath
1,866
Sq Ft
$169/Sq Ft
Est. Value
About This Home
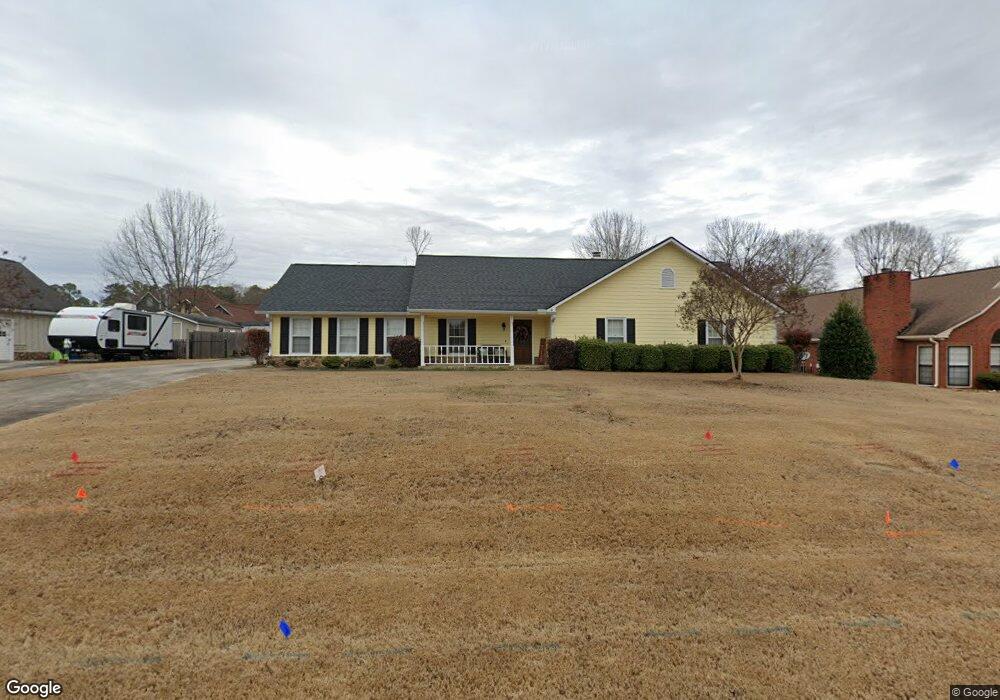
This home is located at 28 Bent Oak Trail NW, Rome, GA 30165 and is currently estimated at $315,762, approximately $169 per square foot. 28 Bent Oak Trail NW is a home located in Floyd County with nearby schools including Armuchee Middle School and Armuchee High School.
Ownership History
Date
Name
Owned For
Owner Type
Purchase Details
Closed on
Oct 27, 2015
Sold by
Scoggins Kimberly J
Bought by
Hutcheson Larry
Current Estimated Value
Home Financials for this Owner
Home Financials are based on the most recent Mortgage that was taken out on this home.
Original Mortgage
$140,000
Outstanding Balance
$110,489
Interest Rate
3.89%
Mortgage Type
New Conventional
Estimated Equity
$205,273
Purchase Details
Closed on
Oct 16, 2012
Sold by
Timberlake Elizabeth B
Bought by
Scoggins Kimberly J
Home Financials for this Owner
Home Financials are based on the most recent Mortgage that was taken out on this home.
Original Mortgage
$111,200
Interest Rate
2.81%
Mortgage Type
New Conventional
Purchase Details
Closed on
Sep 19, 1988
Sold by
Burk William Jr Builders Inc & Citizens
Bought by
Timberlake Elizabeth B
Purchase Details
Closed on
Oct 10, 1984
Bought by
Burk William Jr Builders Inc & Citizens
Create a Home Valuation Report for This Property
The Home Valuation Report is an in-depth analysis detailing your home's value as well as a comparison with similar homes in the area
Home Values in the Area
Average Home Value in this Area
Purchase History
| Date | Buyer | Sale Price | Title Company |
|---|---|---|---|
| Hutcheson Larry | $175,000 | -- | |
| Scoggins Kimberly J | $139,000 | -- | |
| Timberlake Elizabeth B | $95,000 | -- | |
| Burk William Jr Builders Inc & Citizens | -- | -- |
Source: Public Records
Mortgage History
| Date | Status | Borrower | Loan Amount |
|---|---|---|---|
| Open | Hutcheson Larry | $140,000 | |
| Previous Owner | Scoggins Kimberly J | $111,200 |
Source: Public Records
Tax History Compared to Growth
Tax History
| Year | Tax Paid | Tax Assessment Tax Assessment Total Assessment is a certain percentage of the fair market value that is determined by local assessors to be the total taxable value of land and additions on the property. | Land | Improvement |
|---|---|---|---|---|
| 2024 | $3,531 | $112,890 | $10,666 | $102,224 |
| 2023 | $3,299 | $117,525 | $9,332 | $108,193 |
| 2022 | $3,004 | $98,862 | $7,555 | $91,307 |
| 2021 | $2,478 | $79,853 | $7,555 | $72,298 |
| 2020 | $2,344 | $74,896 | $5,777 | $69,119 |
| 2019 | $2,012 | $64,986 | $5,777 | $59,209 |
| 2018 | $1,897 | $61,119 | $5,777 | $55,342 |
| 2017 | $1,827 | $58,667 | $5,777 | $52,890 |
| 2016 | $1,823 | $57,800 | $5,760 | $52,040 |
| 2015 | $1,719 | $57,371 | $5,760 | $51,611 |
| 2014 | $1,719 | $57,371 | $5,760 | $51,611 |
Source: Public Records
Map
Nearby Homes
- 14 Meadowood Dr NW
- 36 Bent Oak Trail NW
- 17 Ashley Oaks Trail NW
- 45 Ashley Oaks Trail NW
- 0 Dempsey St NW
- 63 Hennon Dr NW
- 55 Hennon Dr NW
- 2 Palmer Dr NW
- PEARSON Plan at Old Summerville Village
- 8 Silverbell Ln
- 4 Silverbell Ln
- 12 Silverbell Ln
- 10 Silverbell Ln
- 7 Hogan Ln NW
- 3858 Martha Berry Hwy NE
- 13&15 Crabapple Ln
- 13 & 15 Crabapple Ln NW
- 30 Bent Oak Trail NW
- 30 Bent Oak Trail NW Unit Sec 2
- 26 Bent Oak Trail NW
- 19 Meadowood Dr NW
- 17 Meadowood Dr NW
- 21 Meadowood Dr NW
- 29 Bent Oak Trail NW
- 24 Bent Oak Trail NW
- 31 Bent Oak Trail NW
- 32 Bent Oak Trail NW
- 15 Meadowood Dr NW
- 23 Meadowood Dr NW
- 27 Bent Oak Trail NW
- 33 Bent Oak Trail NW
- 22 Bent Oak Trail NW
- 13 Meadowood Dr NW
- 20 Meadowood Dr NW
- 25 Bent Oak Trail NW
- 35 Bent Oak Trail NW
- 34 Bent Oak Trail NW