28 Bilmore Ln Unit 2 Dahlonega, GA 30533
Estimated Value: $602,409 - $755,000
3
Beds
4
Baths
3,072
Sq Ft
$216/Sq Ft
Est. Value
About This Home
This home is located at 28 Bilmore Ln Unit 2, Dahlonega, GA 30533 and is currently estimated at $663,852, approximately $216 per square foot. 28 Bilmore Ln Unit 2 is a home located in Lumpkin County with nearby schools including Clay County Middle School and Lumpkin County High School.
Ownership History
Date
Name
Owned For
Owner Type
Purchase Details
Closed on
Apr 23, 2013
Sold by
Gary Richardson
Bought by
Harris Richard and Harris Kathryn F
Current Estimated Value
Home Financials for this Owner
Home Financials are based on the most recent Mortgage that was taken out on this home.
Original Mortgage
$185,000
Outstanding Balance
$131,292
Interest Rate
3.59%
Mortgage Type
New Conventional
Estimated Equity
$532,560
Purchase Details
Closed on
Apr 22, 2013
Sold by
Richardson Barbara
Bought by
Richardson Gary
Home Financials for this Owner
Home Financials are based on the most recent Mortgage that was taken out on this home.
Original Mortgage
$185,000
Outstanding Balance
$131,292
Interest Rate
3.59%
Mortgage Type
New Conventional
Estimated Equity
$532,560
Purchase Details
Closed on
Sep 24, 2004
Sold by
Sutton Trey and Sutton Terri
Bought by
Richardson Gary and Richardson Barbara
Purchase Details
Closed on
Feb 4, 2004
Sold by
Plummer Carlton H
Bought by
Sutton Trey and Sutton Terri
Purchase Details
Closed on
Mar 17, 2000
Sold by
Moore J William
Bought by
Plummer Carlton H
Create a Home Valuation Report for This Property
The Home Valuation Report is an in-depth analysis detailing your home's value as well as a comparison with similar homes in the area
Home Values in the Area
Average Home Value in this Area
Purchase History
| Date | Buyer | Sale Price | Title Company |
|---|---|---|---|
| Harris Richard | $285,000 | -- | |
| Richardson Gary | -- | -- | |
| Richardson Gary | $40,000 | -- | |
| Sutton Trey | $30,000 | -- | |
| Plummer Carlton H | $25,000 | -- |
Source: Public Records
Mortgage History
| Date | Status | Borrower | Loan Amount |
|---|---|---|---|
| Open | Harris Richard | $185,000 |
Source: Public Records
Tax History Compared to Growth
Tax History
| Year | Tax Paid | Tax Assessment Tax Assessment Total Assessment is a certain percentage of the fair market value that is determined by local assessors to be the total taxable value of land and additions on the property. | Land | Improvement |
|---|---|---|---|---|
| 2024 | $1,995 | $201,733 | $14,000 | $187,733 |
| 2023 | $1,571 | $189,887 | $14,000 | $175,887 |
| 2022 | $2,085 | $187,865 | $9,600 | $178,265 |
| 2021 | $1,277 | $154,353 | $9,600 | $144,753 |
| 2020 | $1,206 | $150,524 | $9,600 | $140,924 |
| 2019 | $1,230 | $150,524 | $9,600 | $140,924 |
| 2018 | $834 | $132,983 | $9,600 | $123,383 |
| 2017 | $709 | $126,523 | $9,600 | $116,923 |
| 2016 | $639 | $116,852 | $9,600 | $107,252 |
| 2015 | $3,005 | $116,852 | $9,600 | $107,252 |
| 2014 | $3,005 | $118,030 | $9,600 | $108,430 |
| 2013 | -- | $119,209 | $9,600 | $109,609 |
Source: Public Records
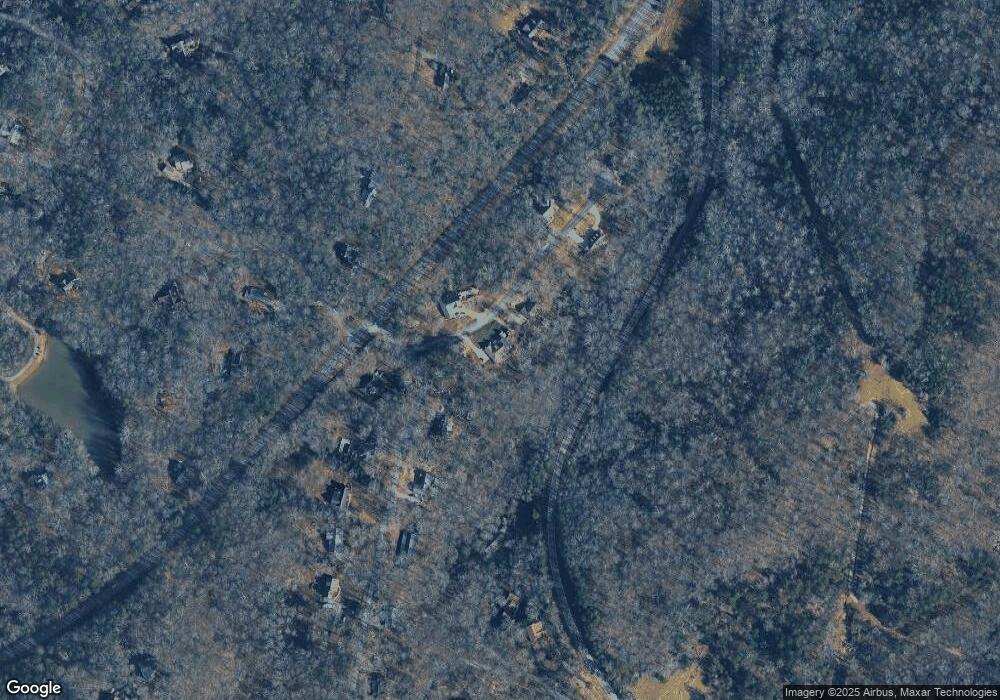
Map
Nearby Homes
- 380 Copper Mill Rd
- 202 Indian Trail
- 128 Young Deer Dr
- 0 Arborwood Dr Unit 10645890
- 87 Tolleffs Trail
- 83 Austin Ct
- 45 Chestatee River Ridge
- 6480 Highway 52 W
- 86.99 Acres Mincie Mountain
- 16 Welch Cir
- 23.86 Acres Mincie Mountain
- 20.65 Acres Mincie Mountain
- 42.65 Acres Mincie Mountain
- 600 Chapman Ridge Ln
- 500 Chapman Ridge Ln
- 27.68 Chapman Ridge Ln
- 28 Bilmore Ln
- 22 Bilmore Ln
- 0 Bilmore Ln Unit 3289132
- 0 Bilmore Ln Unit 7179747
- 0 Bilmore Ln Unit 5067322
- 0 Bilmore Ln Unit 5622954
- 0 Bilmore Ln Unit 7010987
- 0 Bilmore Ln Unit 7044010
- 0 Bilmore Ln Unit 7268794
- LOT 22 Bilmore Ln
- 66 Bilmore Ln
- 49 Bilmore Ln
- 57 Copper Mill Rd
- 117 Bilmore Ln
- 128 Bilmore Ln
- 115 Copper Mill Rd
- 109 Hollow Dr
- 146 Copper Mill Rd
- 24 Copper Mill Rd
- 90 Copper Mill Rd