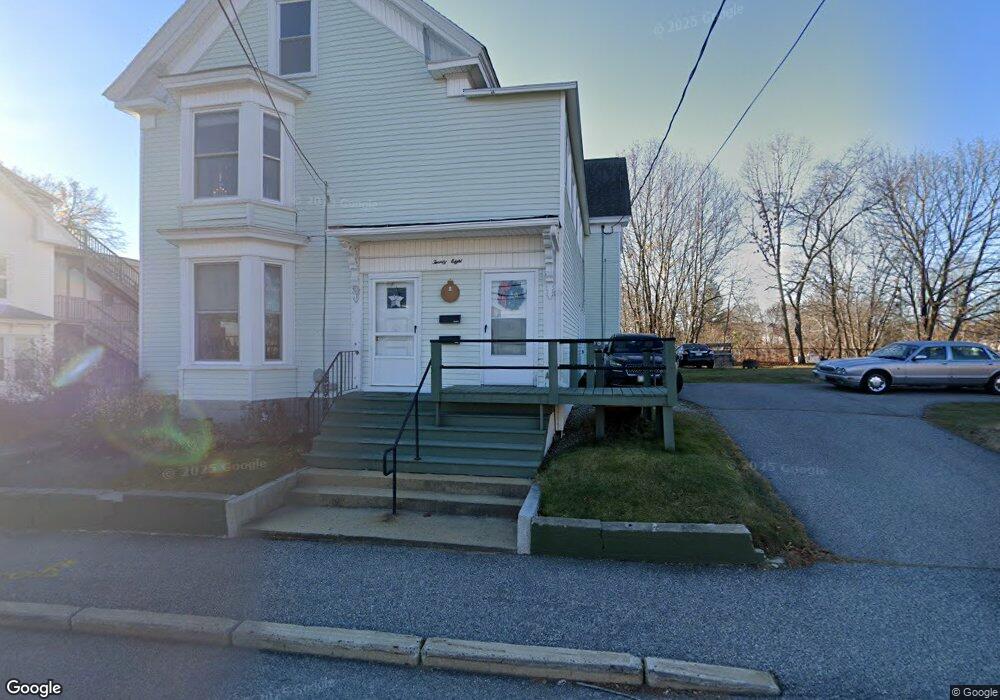
28 Birch St Biddeford, ME 04005
Estimated Value: $600,000 - $749,000
5
Beds
4
Baths
3,485
Sq Ft
$190/Sq Ft
Est. Value
About This Home
This home is located at 28 Birch St, Biddeford, ME 04005 and is currently estimated at $662,787, approximately $190 per square foot. 28 Birch St is a home located in York County with nearby schools including John F Kennedy Memorial School, Biddeford Primary School, and Biddeford Intermediate School.
Ownership History
Date
Name
Owned For
Owner Type
Purchase Details
Closed on
Apr 24, 2024
Sold by
Truman Milton
Bought by
Truman Milton and Truman Nancy A
Current Estimated Value
Purchase Details
Closed on
Oct 31, 2013
Sold by
Truman Plato
Bought by
Truman Milton
Create a Home Valuation Report for This Property
The Home Valuation Report is an in-depth analysis detailing your home's value as well as a comparison with similar homes in the area
Home Values in the Area
Average Home Value in this Area
Purchase History
| Date | Buyer | Sale Price | Title Company |
|---|---|---|---|
| Truman Milton | -- | None Available | |
| Truman Milton | -- | -- | |
| Truman Milton | -- | -- |
Source: Public Records
Tax History Compared to Growth
Tax History
| Year | Tax Paid | Tax Assessment Tax Assessment Total Assessment is a certain percentage of the fair market value that is determined by local assessors to be the total taxable value of land and additions on the property. | Land | Improvement |
|---|---|---|---|---|
| 2024 | $6,055 | $425,800 | $158,200 | $267,600 |
| 2023 | $5,533 | $421,700 | $158,200 | $263,500 |
| 2022 | $4,672 | $284,700 | $86,200 | $198,500 |
| 2021 | $4,446 | $243,900 | $71,800 | $172,100 |
| 2020 | $4,146 | $206,800 | $61,100 | $145,700 |
| 2019 | $4,132 | $206,800 | $61,100 | $145,700 |
| 2018 | $4,074 | $206,800 | $61,100 | $145,700 |
| 2017 | $4,028 | $200,700 | $61,100 | $139,600 |
| 2016 | $3,986 | $200,700 | $61,100 | $139,600 |
| 2015 | $3,908 | $200,700 | $61,100 | $139,600 |
| 2014 | $3,811 | $200,700 | $61,100 | $139,600 |
| 2013 | -- | $249,000 | $71,300 | $177,700 |
Source: Public Records
Map
Nearby Homes
- 128 Alfred St
- 39 Green St
- 109 Alfred Rd
- 21 Wentworth St
- 227 Elm St
- 38 Jefferson St
- 38 South St
- 11 Chadwick Place
- 4 Kossuth St
- 155 Hill St
- 138 Summer St
- 11 King St
- 17 Granite St
- 28 Cutts St
- 7 Oak St
- 2 Main St Unit 17-506
- 2 Main St Unit 15-310
- 2 Main St Unit 15-314
- 2 Main St Unit 17-410
- 2 Main St Unit 17-508