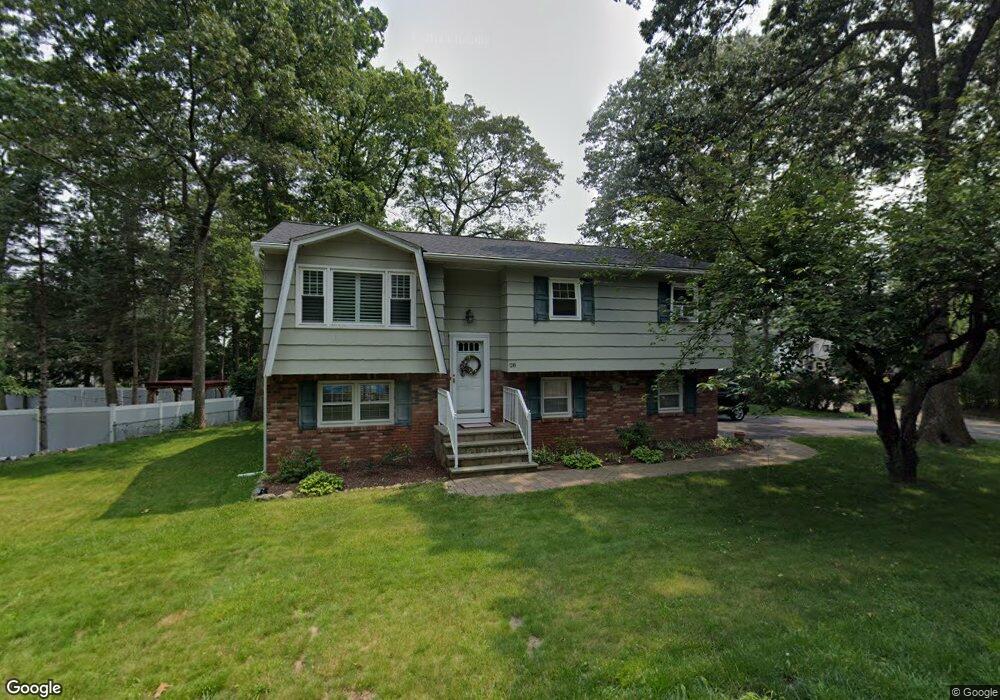
28 Brendona Ave Stanhope, NJ 07874
Estimated Value: $422,000 - $507,000
--
Bed
--
Bath
1,828
Sq Ft
$252/Sq Ft
Est. Value
About This Home
This home is located at 28 Brendona Ave, Stanhope, NJ 07874 and is currently estimated at $460,565, approximately $251 per square foot. 28 Brendona Ave is a home located in Sussex County with nearby schools including Durban Avenue Elementary School, Hudson Maxim Elementary School, and Tulsa Trail Elementary School.
Ownership History
Date
Name
Owned For
Owner Type
Purchase Details
Closed on
Jun 27, 2005
Sold by
Morrison Melvyn J and Morrison Kathleen T
Bought by
Ariza Jose and Ariza Patricia
Current Estimated Value
Home Financials for this Owner
Home Financials are based on the most recent Mortgage that was taken out on this home.
Original Mortgage
$252,000
Outstanding Balance
$131,972
Interest Rate
5.71%
Mortgage Type
Fannie Mae Freddie Mac
Estimated Equity
$328,593
Purchase Details
Closed on
Jun 28, 1995
Sold by
Hewitt Maryann
Bought by
Morrison Melvyn J and Morrison Kathleen T
Create a Home Valuation Report for This Property
The Home Valuation Report is an in-depth analysis detailing your home's value as well as a comparison with similar homes in the area
Home Values in the Area
Average Home Value in this Area
Purchase History
| Date | Buyer | Sale Price | Title Company |
|---|---|---|---|
| Ariza Jose | $315,000 | Horizon Title Agency | |
| Morrison Melvyn J | $137,500 | -- |
Source: Public Records
Mortgage History
| Date | Status | Borrower | Loan Amount |
|---|---|---|---|
| Open | Ariza Jose | $252,000 |
Source: Public Records
Tax History Compared to Growth
Tax History
| Year | Tax Paid | Tax Assessment Tax Assessment Total Assessment is a certain percentage of the fair market value that is determined by local assessors to be the total taxable value of land and additions on the property. | Land | Improvement |
|---|---|---|---|---|
| 2025 | $6,960 | $333,800 | $116,300 | $217,500 |
| 2024 | $7,299 | $333,800 | $116,300 | $217,500 |
| 2023 | $7,299 | $208,600 | $74,900 | $133,700 |
| 2022 | $7,155 | $208,600 | $74,900 | $133,700 |
| 2021 | $7,034 | $208,600 | $74,900 | $133,700 |
| 2020 | $6,961 | $208,600 | $74,900 | $133,700 |
| 2019 | $6,932 | $208,600 | $74,900 | $133,700 |
| 2018 | $6,917 | $208,600 | $74,900 | $133,700 |
| 2017 | $6,907 | $208,600 | $74,900 | $133,700 |
| 2016 | $6,921 | $208,600 | $74,900 | $133,700 |
| 2015 | $6,765 | $208,600 | $74,900 | $133,700 |
| 2014 | $6,742 | $208,600 | $74,900 | $133,700 |
Source: Public Records
Map
Nearby Homes