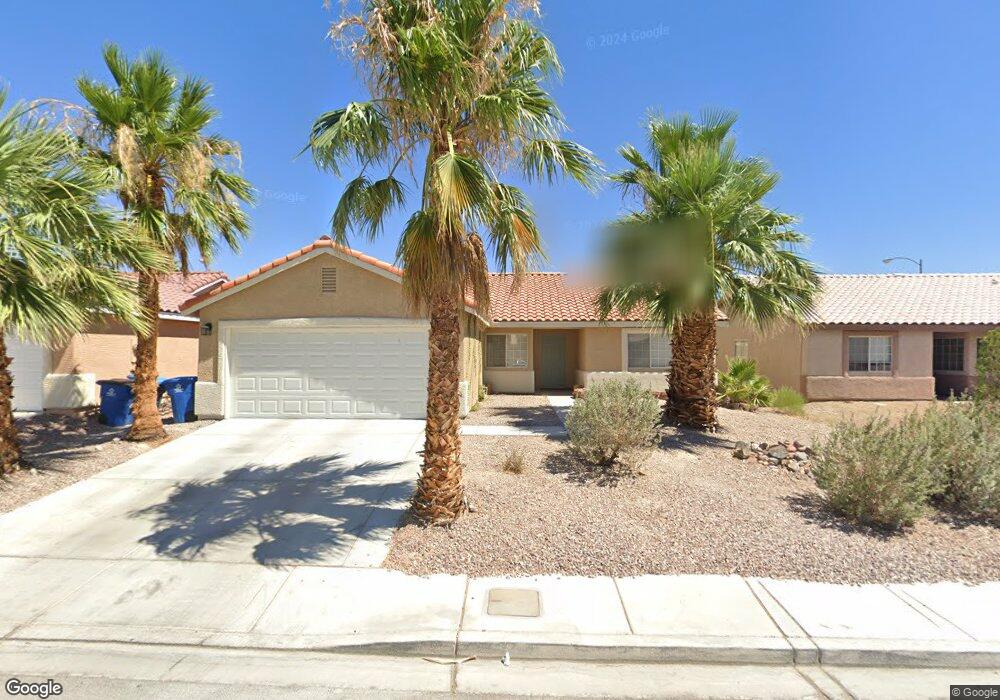
28 Bright Dawn Ave Unit 2 North Las Vegas, NV 89031
Craig Ranch NeighborhoodEstimated Value: $374,000 - $388,000
3
Beds
2
Baths
1,374
Sq Ft
$277/Sq Ft
Est. Value
About This Home
This home is located at 28 Bright Dawn Ave Unit 2, North Las Vegas, NV 89031 and is currently estimated at $380,512, approximately $276 per square foot. 28 Bright Dawn Ave Unit 2 is a home located in Clark County with nearby schools including Raul P. Elizondo Elementary School, Clifford O. Findlay Middle School, and Mojave High School.
Ownership History
Date
Name
Owned For
Owner Type
Purchase Details
Closed on
Apr 25, 2011
Sold by
Michaels Terry and Michaels Rose
Bought by
Rodriguez Ricardo Acosta and Acosta Maria Estela
Current Estimated Value
Purchase Details
Closed on
Dec 20, 2002
Sold by
Michaels Terry and Michaels Rose
Bought by
Michaels Terry and Michaels Rose
Home Financials for this Owner
Home Financials are based on the most recent Mortgage that was taken out on this home.
Original Mortgage
$93,200
Interest Rate
5.86%
Purchase Details
Closed on
Apr 5, 2000
Sold by
Frazier Michelle
Bought by
Michaels Terry H
Home Financials for this Owner
Home Financials are based on the most recent Mortgage that was taken out on this home.
Original Mortgage
$80,000
Interest Rate
8.3%
Purchase Details
Closed on
Jan 27, 1998
Sold by
Frazier Jason
Bought by
Frazier Michelle
Home Financials for this Owner
Home Financials are based on the most recent Mortgage that was taken out on this home.
Original Mortgage
$106,391
Interest Rate
7.05%
Mortgage Type
FHA
Create a Home Valuation Report for This Property
The Home Valuation Report is an in-depth analysis detailing your home's value as well as a comparison with similar homes in the area
Home Values in the Area
Average Home Value in this Area
Purchase History
| Date | Buyer | Sale Price | Title Company |
|---|---|---|---|
| Rodriguez Ricardo Acosta | $61,600 | None Available | |
| Michaels Terry | -- | Nevada Title Company | |
| Michaels Terry H | $122,000 | Nevada Title Company | |
| Michaels Terry H | -- | -- | |
| Frazier Michelle | -- | Nevada Title Company | |
| Frazier Michelle | $108,000 | Nevada Title Company |
Source: Public Records
Mortgage History
| Date | Status | Borrower | Loan Amount |
|---|---|---|---|
| Previous Owner | Michaels Terry | $93,200 | |
| Previous Owner | Michaels Terry H | $80,000 | |
| Previous Owner | Frazier Michelle | $106,391 |
Source: Public Records
Tax History Compared to Growth
Tax History
| Year | Tax Paid | Tax Assessment Tax Assessment Total Assessment is a certain percentage of the fair market value that is determined by local assessors to be the total taxable value of land and additions on the property. | Land | Improvement |
|---|---|---|---|---|
| 2025 | $1,570 | $89,707 | $31,500 | $58,207 |
| 2024 | $1,454 | $89,707 | $31,500 | $58,207 |
| 2023 | $1,454 | $81,256 | $25,900 | $55,356 |
| 2022 | $1,347 | $73,749 | $23,100 | $50,649 |
| 2021 | $1,247 | $68,921 | $20,650 | $48,271 |
| 2020 | $1,155 | $67,940 | $19,950 | $47,990 |
| 2019 | $1,083 | $63,346 | $16,100 | $47,246 |
| 2018 | $1,033 | $58,244 | $12,600 | $45,644 |
| 2017 | $1,876 | $55,925 | $11,900 | $44,025 |
| 2016 | $968 | $47,291 | $8,400 | $38,891 |
| 2015 | $965 | $34,752 | $5,950 | $28,802 |
| 2014 | $935 | $27,930 | $4,900 | $23,030 |
Source: Public Records
Map
Nearby Homes
- 212 Stagecoach Flats Ave
- 138 Red Sandstone Ave
- 210 Red Sandstone Ave
- 138 Scarlett View Ave
- 129 Thorntree Ave
- 5640 Vermillion Ridge St
- 5509 Tea Leaf St
- 5637 Vermillion Ridge St
- 221 Mountain Cedar Ct
- 210 Mountain Cedar Ct
- 5703 Salt Rock St
- 5521 Moss Landing St
- 5505 Moss Landing St
- 408 Colorful Rain Ave
- 5709 Jaysin Douglas St
- 438 Shimmering Sands Ave
- 415 Carsin Wayne Ave
- 5512 Pride Mountain St
- 449 Orchid Oasis Ave
- 5517 Meridian Rain St
- 24 Bright Dawn Ave
- 32 Bright Dawn Ave
- 20 Bright Dawn Ave
- 36 Bright Dawn Ave
- 31 Bright Dawn Ave
- 27 Bright Dawn Ave
- 16 Bright Dawn Ave
- 16 Bright Dawn Ave
- 16 Bright Dawn Ave
- 16 Bright Dawn Ave
- 16 W Bright Dawn Ave
- 35 Bright Dawn Ave
- 23 Bright Dawn Ave
- 40 Bright Dawn Ave
- 5529 Summer Night St
- 27 Red Sandstone Ave
- 12 Bright Dawn Ave
- 5533 Soft Whispers St
- 31 Red Sandstone Ave
- 23 Red Sandstone Ave