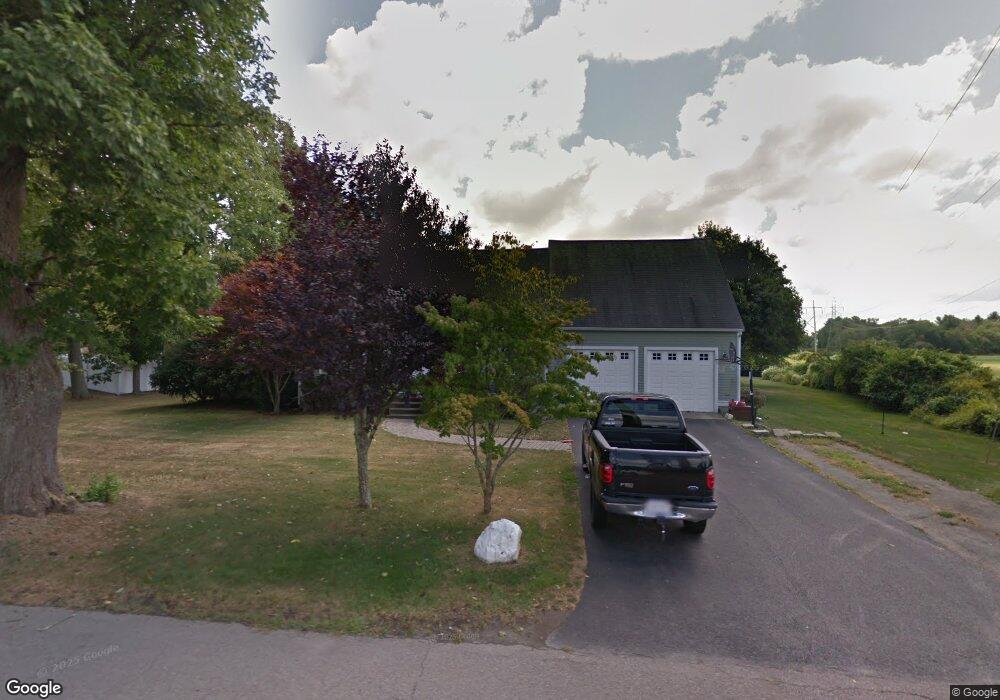
28 Bryant St West Bridgewater, MA 02379
Estimated Value: $622,000 - $729,000
3
Beds
3
Baths
2,615
Sq Ft
$265/Sq Ft
Est. Value
About This Home
This home is located at 28 Bryant St, West Bridgewater, MA 02379 and is currently estimated at $692,529, approximately $264 per square foot. 28 Bryant St is a home located in Plymouth County with nearby schools including Spring Street Elementary School, Howard Elementary School, and Rose L. MacDonald Elementary School.
Ownership History
Date
Name
Owned For
Owner Type
Purchase Details
Closed on
May 30, 2019
Sold by
Palin Richard J and Palin Lisa J
Bought by
Richard J Palin Ret
Current Estimated Value
Purchase Details
Closed on
Jul 29, 1996
Sold by
Peck John A
Bought by
Palin Richard J and Palin Lisa J
Home Financials for this Owner
Home Financials are based on the most recent Mortgage that was taken out on this home.
Original Mortgage
$132,600
Interest Rate
8.37%
Mortgage Type
Purchase Money Mortgage
Create a Home Valuation Report for This Property
The Home Valuation Report is an in-depth analysis detailing your home's value as well as a comparison with similar homes in the area
Home Values in the Area
Average Home Value in this Area
Purchase History
| Date | Buyer | Sale Price | Title Company |
|---|---|---|---|
| Richard J Palin Ret | -- | -- | |
| Palin Richard J | $139,600 | -- | |
| Palin Richard J | $139,600 | -- |
Source: Public Records
Mortgage History
| Date | Status | Borrower | Loan Amount |
|---|---|---|---|
| Previous Owner | Palin Richard J | $117,500 | |
| Previous Owner | Palin Richard J | $170,000 | |
| Previous Owner | Palin Richard J | $132,300 | |
| Previous Owner | Palin Richard J | $132,600 |
Source: Public Records
Tax History Compared to Growth
Tax History
| Year | Tax Paid | Tax Assessment Tax Assessment Total Assessment is a certain percentage of the fair market value that is determined by local assessors to be the total taxable value of land and additions on the property. | Land | Improvement |
|---|---|---|---|---|
| 2025 | $8,415 | $615,600 | $235,300 | $380,300 |
| 2024 | $7,828 | $552,400 | $214,700 | $337,700 |
| 2023 | $7,570 | $492,500 | $192,000 | $300,500 |
| 2022 | $7,093 | $437,300 | $177,500 | $259,800 |
| 2021 | $6,868 | $411,000 | $169,300 | $241,700 |
| 2020 | $6,340 | $387,300 | $169,300 | $218,000 |
| 2019 | $6,333 | $383,100 | $169,300 | $213,800 |
| 2018 | $7,869 | $364,000 | $154,800 | $209,200 |
| 2017 | $6,182 | $348,700 | $144,500 | $204,200 |
| 2016 | $6,165 | $342,500 | $138,300 | $204,200 |
| 2015 | $5,774 | $324,200 | $138,300 | $185,900 |
| 2014 | $5,145 | $312,000 | $130,500 | $181,500 |
Source: Public Records
Map
Nearby Homes