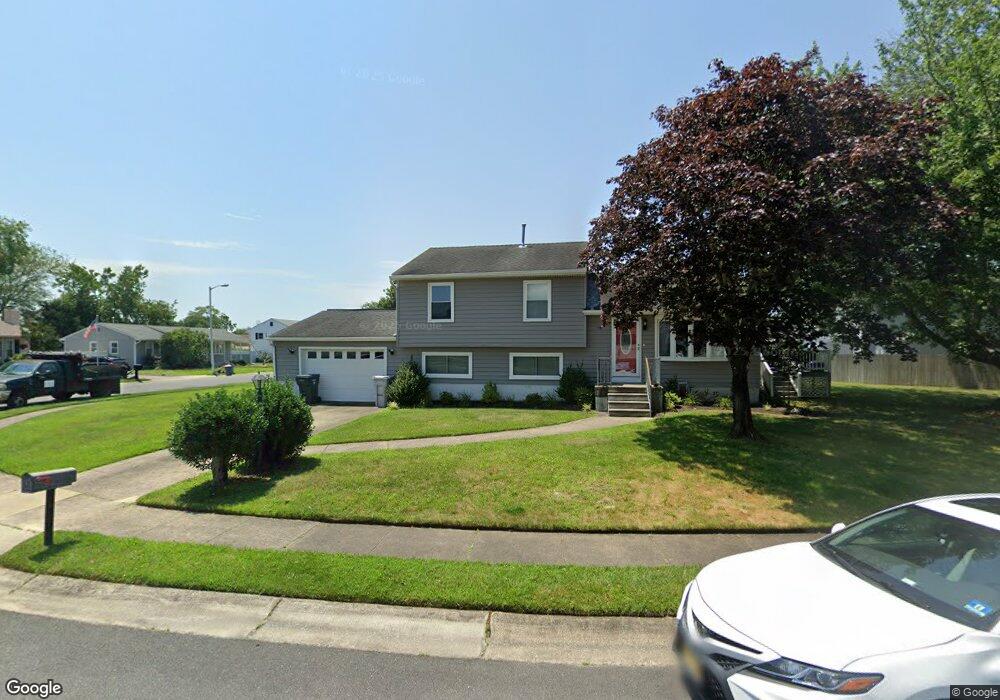
28 Bucknell Rd Somers Point, NJ 08244
Estimated Value: $418,000 - $474,000
--
Bed
--
Bath
1,655
Sq Ft
$268/Sq Ft
Est. Value
About This Home
This home is located at 28 Bucknell Rd, Somers Point, NJ 08244 and is currently estimated at $442,971, approximately $267 per square foot. 28 Bucknell Rd is a home located in Atlantic County with nearby schools including Mainland Regional High School, ChARTer TECH High School for the Performing Arts, and Saint Joseph Regional School.
Ownership History
Date
Name
Owned For
Owner Type
Purchase Details
Closed on
Jun 20, 2001
Sold by
Perez Anibal and Perez Caroline
Bought by
Fogg Ronald and Fogg Donna R
Current Estimated Value
Home Financials for this Owner
Home Financials are based on the most recent Mortgage that was taken out on this home.
Original Mortgage
$140,577
Outstanding Balance
$53,549
Interest Rate
7.14%
Mortgage Type
Purchase Money Mortgage
Estimated Equity
$389,422
Create a Home Valuation Report for This Property
The Home Valuation Report is an in-depth analysis detailing your home's value as well as a comparison with similar homes in the area
Home Values in the Area
Average Home Value in this Area
Purchase History
| Date | Buyer | Sale Price | Title Company |
|---|---|---|---|
| Fogg Ronald | $153,500 | -- |
Source: Public Records
Mortgage History
| Date | Status | Borrower | Loan Amount |
|---|---|---|---|
| Open | Fogg Ronald | $140,577 |
Source: Public Records
Tax History Compared to Growth
Tax History
| Year | Tax Paid | Tax Assessment Tax Assessment Total Assessment is a certain percentage of the fair market value that is determined by local assessors to be the total taxable value of land and additions on the property. | Land | Improvement |
|---|---|---|---|---|
| 2025 | $7,166 | $200,400 | $70,000 | $130,400 |
| 2024 | $7,166 | $200,400 | $70,000 | $130,400 |
| 2023 | $6,695 | $200,400 | $70,000 | $130,400 |
| 2022 | $6,695 | $200,400 | $70,000 | $130,400 |
| 2021 | $6,595 | $200,400 | $70,000 | $130,400 |
| 2020 | $6,461 | $200,400 | $70,000 | $130,400 |
| 2019 | $6,279 | $200,400 | $70,000 | $130,400 |
| 2018 | $6,358 | $207,300 | $70,000 | $137,300 |
| 2017 | $6,130 | $207,300 | $70,000 | $137,300 |
| 2016 | $5,852 | $207,300 | $70,000 | $137,300 |
| 2015 | $5,792 | $207,300 | $70,000 | $137,300 |
| 2014 | $5,597 | $207,300 | $70,000 | $137,300 |
Source: Public Records
Map
Nearby Homes