P
Seller's Agent in 2021
Paul Yarmo
Coldwell Banker Realty Nashua
Estimated Value: $380,000 - $452,000
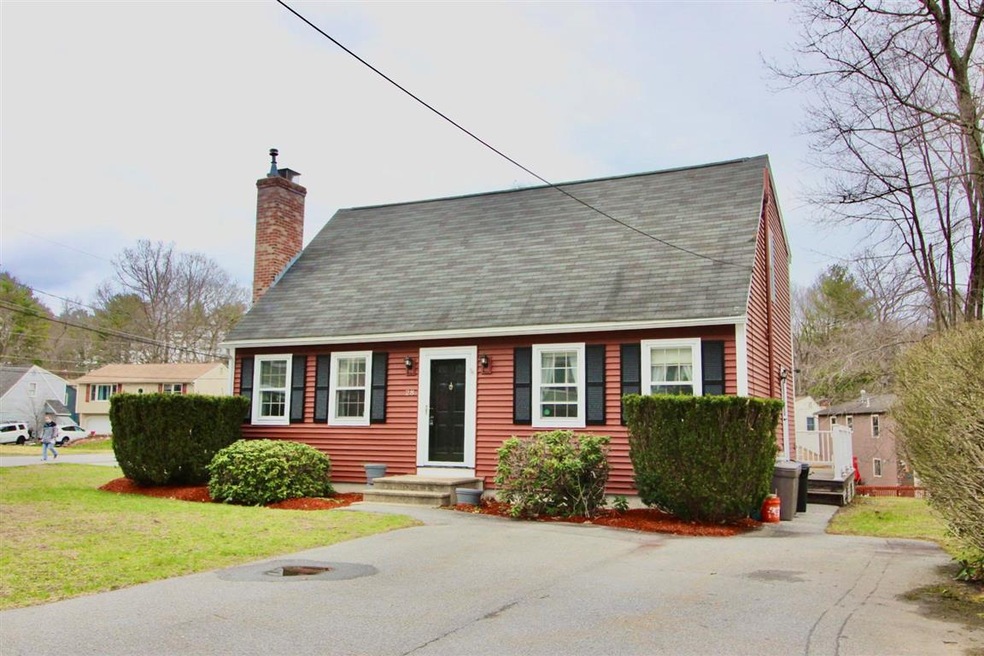
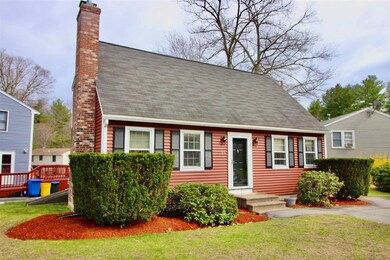
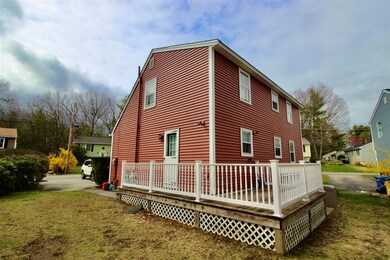
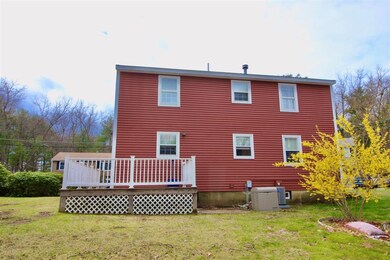
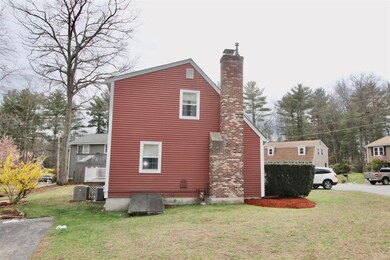
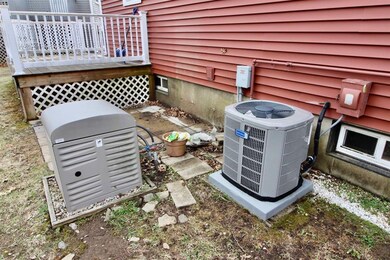
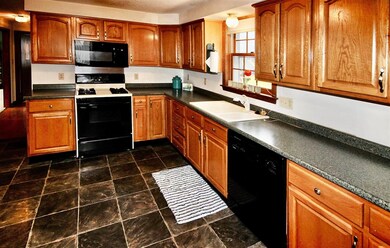
This home is a charming detached full dormered cape style 3 bedroom 2 full bath condo in Windsor Pond Condominiums. Convenient to highway commuter linkages (Exit 5), schools and shopping. This home has an updated kitchen, newer appliances, a new Kohler "auto-on" standby generator, new central air conditioning, new vinyl siding, a partially finished basement and an open deck. Low condo fee is $175 per month. Showings start during the open house which is on Saturday, 4/24 from 11 AM to 1 PM.
Last Agent to Sell the Property
Paul Yarmo
Coldwell Banker Realty Nashua License #002157 Listed on: 04/21/2021

Last Buyer's Agent
Daniel Maffee
Purple Finch Properties License #070200
| Date | Buyer | Sale Price | Title Company |
|---|---|---|---|
| Bush Lori A | $320,000 | None Available | |
| Arnold Michael R | $104,900 | -- |
| Date | Status | Borrower | Loan Amount |
|---|---|---|---|
| Open | Bush Lori A | $200,000 | |
| Previous Owner | Arnold Michael R | $134,950 | |
| Previous Owner | Arnold Michael R | $99,655 |
| Date | Event | Price | List to Sale | Price per Sq Ft |
|---|---|---|---|---|
| 06/11/2021 06/11/21 | Sold | $320,000 | +10.4% | $224 / Sq Ft |
| 04/26/2021 04/26/21 | Pending | -- | -- | -- |
| 04/21/2021 04/21/21 | For Sale | $289,900 | -- | $203 / Sq Ft |
| Year | Tax Paid | Tax Assessment Tax Assessment Total Assessment is a certain percentage of the fair market value that is determined by local assessors to be the total taxable value of land and additions on the property. | Land | Improvement |
|---|---|---|---|---|
| 2024 | $6,343 | $398,900 | $0 | $398,900 |
| 2023 | $5,865 | $321,700 | $0 | $321,700 |
| 2022 | $5,813 | $321,700 | $0 | $321,700 |
| 2021 | $5,273 | $227,100 | $0 | $227,100 |
| 2020 | $5,236 | $231,600 | $0 | $231,600 |
| 2019 | $5,040 | $231,600 | $0 | $231,600 |
| 2018 | $4,912 | $231,600 | $0 | $231,600 |
| 2017 | $4,727 | $183,300 | $0 | $183,300 |
| 2016 | $4,595 | $183,300 | $0 | $183,300 |
| 2015 | $4,496 | $183,300 | $0 | $183,300 |
| 2014 | $4,408 | $183,300 | $0 | $183,300 |
P
Seller's Agent in 2021
Paul Yarmo
Coldwell Banker Realty Nashua
D
Buyer's Agent in 2021
Daniel Maffee
Purple Finch Properties
Source: PrimeMLS
MLS Number: 4856896
APN: NASH-000000-001382-000037C
Disclaimer: Certain information contained herein is derived from information provided by parties other than Homes.com. All information provided is deemed reliable, but is not guaranteed to be accurate and should be independently verified.
![]() Copyright 2025 PrimeMLS, Inc. All rights reserved. This information is deemed reliable, but not guaranteed. The data relating to real estate displayed on this display comes in part from the IDX Program of PrimeMLS. The information being provided is for consumers’ personal, non-commercial use and may not be used for any purpose other than to identify prospective properties consumers may be interested in purchasing.
Copyright 2025 PrimeMLS, Inc. All rights reserved. This information is deemed reliable, but not guaranteed. The data relating to real estate displayed on this display comes in part from the IDX Program of PrimeMLS. The information being provided is for consumers’ personal, non-commercial use and may not be used for any purpose other than to identify prospective properties consumers may be interested in purchasing.