28 Cedar Ln Unit 1 Kingston, MA 02364
Estimated Value: $644,000 - $720,000
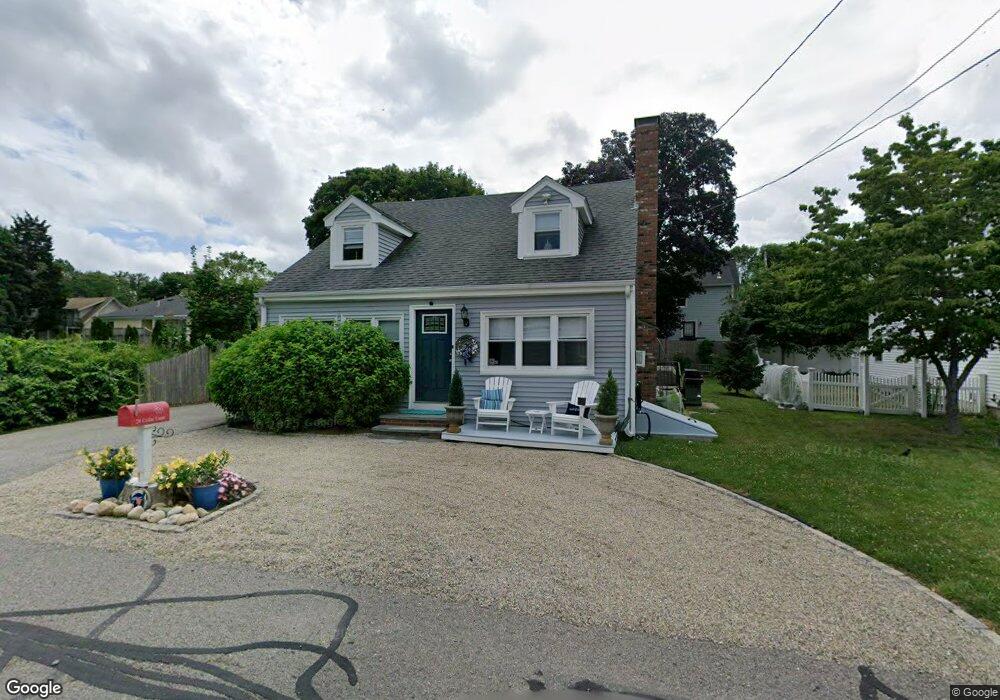
About This Home
This home is located at 28 Cedar Ln Unit 1, Kingston, MA 02364 and is currently estimated at $672,950, approximately $416 per square foot. 28 Cedar Ln Unit 1 is a home located in Plymouth County with nearby schools including Kingston Elementary School, Silver Lake Regional High School, and Kingston Intermediate School.
Ownership History
We collect this data history from publicly available records. To have your information removed, we recommend requesting removal directly through your county’s website.
Purchase Details
Home Financials for this Owner
Home Financials are based on the most recent Mortgage that was taken out on this home.Purchase Details
Purchase Details
Home Values in the Area
Average Home Value in this Area
Purchase History
We collect this data history from publicly available records. To have your information removed, we recommend requesting removal directly through your county’s website.
| Date | Buyer | Sale Price | Title Company |
|---|---|---|---|
| $386,000 | -- | ||
| $365,000 | -- | ||
| $365,000 | -- | ||
| $299,000 | -- | ||
| $299,000 | -- |
Mortgage History
We collect this data history from publicly available records. To have your information removed, we recommend requesting removal directly through your county’s website.
| Date | Status | Borrower | Loan Amount |
|---|---|---|---|
| Open | $379,008 | ||
| Previous Owner | $288,311 | ||
| Previous Owner | $38,000 | ||
| Previous Owner | $10,000 |
Tax History
We collect this data history from publicly available records. To have your information removed, we recommend requesting removal directly through your county’s website.
| Year | Tax Paid | Tax Assessment Tax Assessment Total Assessment is a certain percentage of the fair market value that is determined by local assessors to be the total taxable value of land and additions on the property. | Land | Improvement |
|---|---|---|---|---|
| 2025 | $6,364 | $490,700 | $184,700 | $306,000 |
| 2024 | $6,124 | $481,800 | $184,700 | $297,100 |
| 2023 | $5,900 | $441,600 | $184,700 | $256,900 |
| 2022 | $6,007 | $412,000 | $175,200 | $236,800 |
| 2021 | $5,753 | $357,800 | $159,500 | $198,300 |
| 2020 | $5,586 | $343,100 | $155,600 | $187,500 |
| 2019 | $5,766 | $350,300 | $148,900 | $201,400 |
| 2018 | $5,308 | $322,700 | $148,900 | $173,800 |
| 2017 | $4,670 | $283,000 | $142,500 | $140,500 |
| 2016 | $4,098 | $232,700 | $128,700 | $104,000 |
| 2015 | $3,913 | $231,000 | $128,700 | $102,300 |
| 2014 | $3,731 | $223,700 | $123,100 | $100,600 |
Map
- 24 Holmes Ave
- 13 Atwood St
- 59 Howlands Ln
- 23 Chilton Ave
- Lot 17-3 Howlands Ln
- 17 East Ave
- 735 Bay Rd
- 17 Howlands Ln
- 40 Landing Rd
- 110 Main St
- 44 Seabury Point Rd
- 38 Landing Rd
- 9 Puritan Way
- 15 Priscilla Ave
- 36 Mayflower St
- 26 Bay Farm Rd
- 28 Main St
- 58 Bay Farm Rd
- 54 Bay Farm Rd
- Lot 17-1 Howland's Ln
Ask me questions while you tour the home.