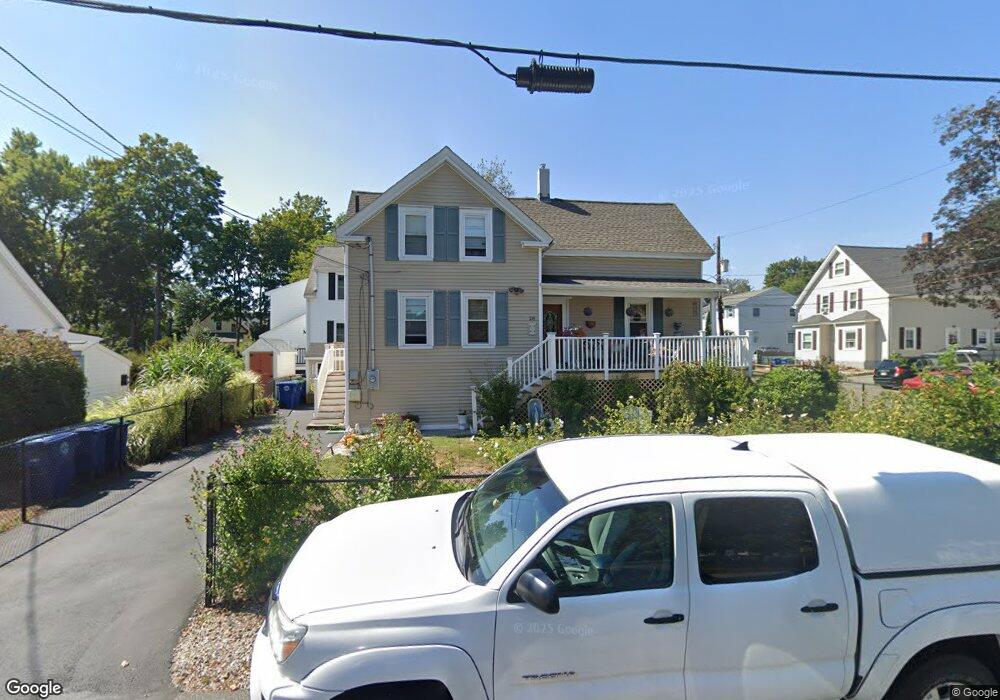
28 Central St Braintree, MA 02184
South Braintree NeighborhoodEstimated Value: $584,000 - $672,000
3
Beds
2
Baths
1,222
Sq Ft
$500/Sq Ft
Est. Value
About This Home
This home is located at 28 Central St, Braintree, MA 02184 and is currently estimated at $610,962, approximately $499 per square foot. 28 Central St is a home located in Norfolk County with nearby schools including Braintree High School, Step Ahead Kindergarten, and Meeting House Montessori School.
Ownership History
Date
Name
Owned For
Owner Type
Purchase Details
Closed on
Jun 29, 2011
Sold by
Higgins Janice C and Higgins Richard R
Bought by
Coyne John G and Coyne Mary T
Current Estimated Value
Home Financials for this Owner
Home Financials are based on the most recent Mortgage that was taken out on this home.
Original Mortgage
$100,000
Outstanding Balance
$69,153
Interest Rate
4.62%
Mortgage Type
Purchase Money Mortgage
Estimated Equity
$541,809
Create a Home Valuation Report for This Property
The Home Valuation Report is an in-depth analysis detailing your home's value as well as a comparison with similar homes in the area
Home Values in the Area
Average Home Value in this Area
Purchase History
| Date | Buyer | Sale Price | Title Company |
|---|---|---|---|
| Coyne John G | $232,000 | -- |
Source: Public Records
Mortgage History
| Date | Status | Borrower | Loan Amount |
|---|---|---|---|
| Open | Coyne John G | $100,000 |
Source: Public Records
Tax History
| Year | Tax Paid | Tax Assessment Tax Assessment Total Assessment is a certain percentage of the fair market value that is determined by local assessors to be the total taxable value of land and additions on the property. | Land | Improvement |
|---|---|---|---|---|
| 2025 | $5,113 | $512,300 | $308,200 | $204,100 |
| 2024 | $4,629 | $488,300 | $287,400 | $200,900 |
| 2023 | $4,373 | $448,100 | $258,200 | $189,900 |
| 2022 | $4,210 | $423,100 | $233,200 | $189,900 |
| 2021 | $3,877 | $389,600 | $210,700 | $178,900 |
| 2020 | $3,577 | $362,800 | $191,600 | $171,200 |
| 2019 | $3,452 | $342,100 | $183,300 | $158,800 |
| 2018 | $3,359 | $318,700 | $166,600 | $152,100 |
| 2017 | $3,239 | $301,600 | $158,300 | $143,300 |
| 2016 | $2,973 | $270,800 | $133,300 | $137,500 |
| 2015 | $2,924 | $264,100 | $131,600 | $132,500 |
| 2014 | $2,770 | $242,600 | $120,000 | $122,600 |
Source: Public Records
Map
Nearby Homes
- 6 Franklin St
- 145 Hancock St Unit 307
- 145 Hancock St Unit 309
- 145 Hancock St Unit 201
- 5 Woodsum Dr Unit 12
- 18 Royal Lake Dr Unit 3
- 418 John Mahar Hwy Unit 408
- 29 Saint Michael Rd
- 422 John Mahar Hwy Unit 408
- 6 Oak St
- 426 John Mahar Hwy Unit 311
- 491 Washington St Unit 1
- 6 Lunar Ave
- 36 Chestnut Ave
- 80 Lake St
- 50 Cleveland Ave
- 7 Del's Way
- 31 Doris Rd
- 15 Calvin St
- 47 Addison St
- 36 Central St Unit One
- 26 Central St
- 36 Taylor St
- 33 Taylor St
- 24 Central St
- 42 Taylor St
- 42 Taylor St Unit 2
- 42 Taylor St Unit 1
- 37 Taylor St Unit 39
- 31 Taylor St
- 25 Taylor St Unit 4L
- 25 Taylor St Unit 3R
- 25 Taylor St Unit 3
- 25 Taylor St
- 16 Taylor St Unit 16
- 14 Taylor St Unit 16
- 14 Taylor St Unit 14
- 43 Taylor St Unit 1
- 20 Central St
- 50 Taylor St
Your Personal Tour Guide
Ask me questions while you tour the home.