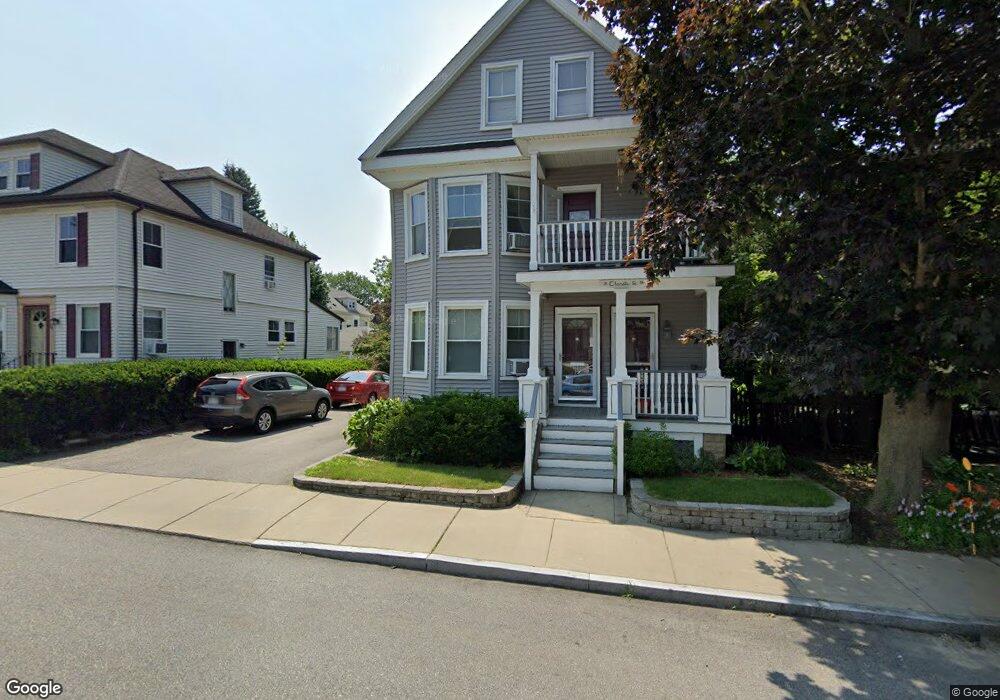
28 Chandler St Haverhill, MA 01835
Central Bradford NeighborhoodEstimated Value: $693,982 - $924,000
7
Beds
2
Baths
2,516
Sq Ft
$311/Sq Ft
Est. Value
About This Home
This home is located at 28 Chandler St, Haverhill, MA 01835 and is currently estimated at $782,996, approximately $311 per square foot. 28 Chandler St is a home located in Essex County with nearby schools including Greenleaf Academy, Bradford Elementary School, and Haverhill High School.
Ownership History
Date
Name
Owned For
Owner Type
Purchase Details
Closed on
Oct 16, 2024
Sold by
Obrien
Bought by
Marnel Group Irt and Coppola
Current Estimated Value
Purchase Details
Closed on
Jan 31, 1990
Sold by
Dandurant Richard
Bought by
Obrien Nelson
Home Financials for this Owner
Home Financials are based on the most recent Mortgage that was taken out on this home.
Original Mortgage
$167,000
Interest Rate
9.59%
Mortgage Type
Purchase Money Mortgage
Create a Home Valuation Report for This Property
The Home Valuation Report is an in-depth analysis detailing your home's value as well as a comparison with similar homes in the area
Home Values in the Area
Average Home Value in this Area
Purchase History
| Date | Buyer | Sale Price | Title Company |
|---|---|---|---|
| Marnel Group Irt | -- | None Available | |
| Marnel Group Irt | -- | None Available | |
| Obrien Nelson | $167,000 | -- |
Source: Public Records
Mortgage History
| Date | Status | Borrower | Loan Amount |
|---|---|---|---|
| Previous Owner | Obrien Nelson | $167,000 |
Source: Public Records
Tax History Compared to Growth
Tax History
| Year | Tax Paid | Tax Assessment Tax Assessment Total Assessment is a certain percentage of the fair market value that is determined by local assessors to be the total taxable value of land and additions on the property. | Land | Improvement |
|---|---|---|---|---|
| 2025 | $6,718 | $627,300 | $181,400 | $445,900 |
| 2024 | $6,087 | $572,100 | $181,400 | $390,700 |
| 2023 | $5,819 | $521,900 | $170,900 | $351,000 |
| 2022 | $5,718 | $449,500 | $163,300 | $286,200 |
| 2021 | $5,458 | $406,100 | $149,700 | $256,400 |
| 2020 | $5,271 | $387,600 | $145,100 | $242,500 |
| 2019 | $5,129 | $367,700 | $145,100 | $222,600 |
| 2018 | $4,933 | $345,900 | $139,100 | $206,800 |
| 2017 | $4,319 | $288,100 | $121,000 | $167,100 |
| 2016 | $4,327 | $281,700 | $114,900 | $166,800 |
| 2015 | $3,894 | $253,700 | $102,800 | $150,900 |
Source: Public Records
Map
Nearby Homes
- 1 New Hampshire Ave
- 56 S Prospect St
- 15 Blossom St
- 41 S Lincoln St
- 40 Haseltine St
- 81 Middlesex St
- 72 River St Unit 4
- 72 River St Unit 1
- 72 River St Unit 7
- 72 River St Unit 3
- 72 River St Unit 2
- 72 River St Unit 5
- 72 River St Unit 8
- 27 Byron St
- 12 Salem St Unit 2
- 24 Washington St Unit 402
- 36 S Spring St
- 80 Wingate St Unit 4C
- 80 Wingate St Unit 3C
- 37 Byron St
- 44 Chandler St
- 26 Chandler St
- 46 Chandler St
- 31 Chandler St
- 24 Chandler St
- 37 Bradford Ave
- 25 Chandler St
- 33 Chandler St
- 33 Bradford Ave
- 33 Bradford Ave Unit 2
- 33 Bradford Ave Unit 1
- 48 Chandler St
- 35 Chandler St
- 21 Chandler St
- 29 Bradford Ave
- 29 Bradford Ave Unit 1
- 18 Chandler St
- 43 Bradford Ave
- 45 Chandler St
- 31 Bradford Ave Unit 2