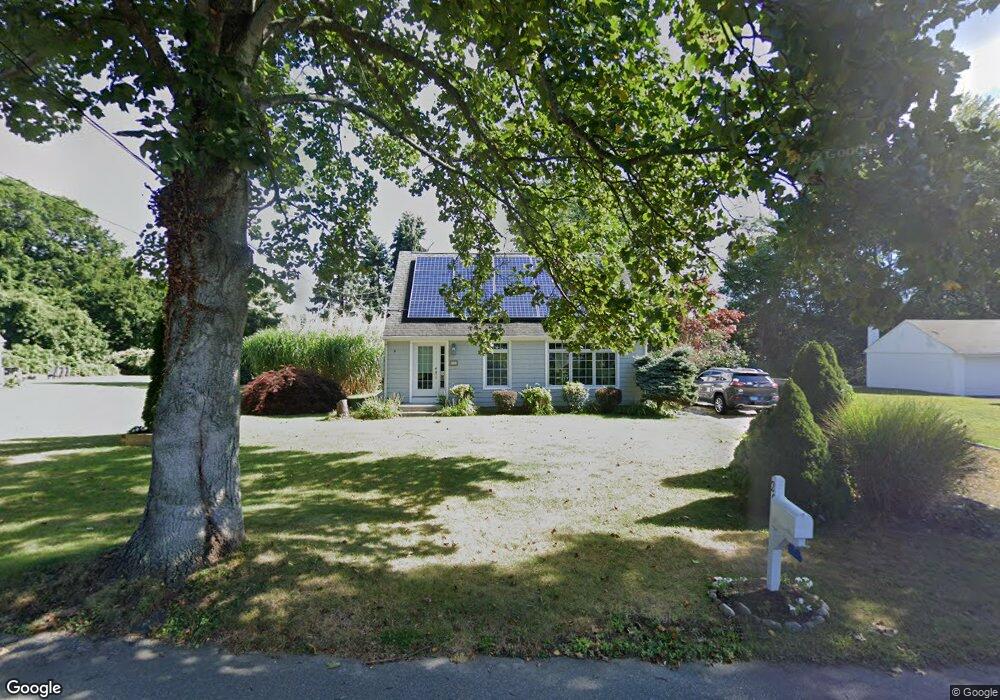
28 Chapman Beach Rd Westbrook, CT 06498
Estimated Value: $524,000 - $776,000
2
Beds
3
Baths
1,306
Sq Ft
$466/Sq Ft
Est. Value
About This Home
This home is located at 28 Chapman Beach Rd, Westbrook, CT 06498 and is currently estimated at $608,260, approximately $465 per square foot. 28 Chapman Beach Rd is a home located in Middlesex County with nearby schools including Daisy Ingraham School, Westbrook Middle School, and Westbrook High School.
Ownership History
Date
Name
Owned For
Owner Type
Purchase Details
Closed on
Jan 14, 2015
Sold by
Pellico Linda H
Bought by
Pellico Johnl
Current Estimated Value
Purchase Details
Closed on
Jun 4, 2007
Sold by
Maccarone Francesco
Bought by
Pellico John and Pellico Linda
Purchase Details
Closed on
Jul 3, 2002
Sold by
Phillips Dennis P
Bought by
Maccarone Francesco A
Home Financials for this Owner
Home Financials are based on the most recent Mortgage that was taken out on this home.
Original Mortgage
$144,000
Interest Rate
6%
Mortgage Type
Purchase Money Mortgage
Purchase Details
Closed on
Jun 16, 1993
Sold by
Baker Kathleen M
Bought by
Phillips Dennis P and Phillips Deborah A
Home Financials for this Owner
Home Financials are based on the most recent Mortgage that was taken out on this home.
Original Mortgage
$114,690
Interest Rate
7.38%
Mortgage Type
Purchase Money Mortgage
Create a Home Valuation Report for This Property
The Home Valuation Report is an in-depth analysis detailing your home's value as well as a comparison with similar homes in the area
Home Values in the Area
Average Home Value in this Area
Purchase History
| Date | Buyer | Sale Price | Title Company |
|---|---|---|---|
| Pellico Johnl | -- | -- | |
| Pellico John | $385,000 | -- | |
| Maccarone Francesco A | $180,000 | -- | |
| Phillips Dennis P | $116,000 | -- |
Source: Public Records
Mortgage History
| Date | Status | Borrower | Loan Amount |
|---|---|---|---|
| Previous Owner | Phillips Dennis P | $225,000 | |
| Previous Owner | Phillips Dennis P | $144,000 | |
| Previous Owner | Phillips Dennis P | $114,690 |
Source: Public Records
Tax History
| Year | Tax Paid | Tax Assessment Tax Assessment Total Assessment is a certain percentage of the fair market value that is determined by local assessors to be the total taxable value of land and additions on the property. | Land | Improvement |
|---|---|---|---|---|
| 2025 | $5,621 | $249,820 | $149,180 | $100,640 |
| 2024 | $5,421 | $249,820 | $149,180 | $100,640 |
| 2023 | $5,326 | $249,820 | $149,180 | $100,640 |
| 2022 | $5,186 | $249,820 | $149,180 | $100,640 |
| 2021 | $5,417 | $216,660 | $124,320 | $92,340 |
| 2020 | $5,417 | $216,660 | $124,320 | $92,340 |
| 2019 | $5,345 | $216,660 | $124,320 | $92,340 |
| 2018 | $5,280 | $216,660 | $124,320 | $92,340 |
| 2017 | $5,280 | $216,660 | $124,320 | $92,340 |
| 2016 | $5,544 | $239,570 | $143,660 | $95,910 |
| 2015 | $5,393 | $239,570 | $143,660 | $95,910 |
| 2014 | $5,220 | $239,570 | $143,660 | $95,910 |
Source: Public Records
Map
Nearby Homes
- 1780 Boston Post Rd
- 8 Cook Terrace
- 118 Sandy Point Rd
- 21 Harvey Dr
- 14 Denmore Ln
- 39 Sagamore Terrace Rd
- 10 Winterberry Cir
- 122 Old Post Rd
- 29 Salt Island Rd
- 39 Middletown Ave
- 41 Trolley Rd
- 25 Sunset Rd Unit 7
- 60 Ingham Hill Rd
- 11 S View Terrace
- 167 Ingham Hill Rd
- 0 Merritt Ln
- 18 Quarry St
- 11a/11b Pond Circle Rd
- 1020 Old Clinton Rd
- 207 Pettipaug Rd
- 42 Chapman Beach Rd
- 14 Chapman Beach Rd
- 20 Chapman Beach Rd
- 43 Chapman Beach Rd
- 2 Chapman Beach Rd
- 0 Chapman Beach Rd
- 54 Chapman Beach Rd
- 1961 Boston Post Rd
- 128 Waldron Dr
- 2011 Boston Post Rd
- 2015 Boston Post Rd
- 70 Chapman Beach Rd
- 120 Waldron Dr
- 65 Chapman Beach Rd
- 125 Waldron Dr
- 77 Chapman Beach Rd
- 1935 Boston Post Rd
- 58 Chapman Beach Rd
- 58 Chapman Beach Rd
- 82 Chapman Beach Rd
Your Personal Tour Guide
Ask me questions while you tour the home.