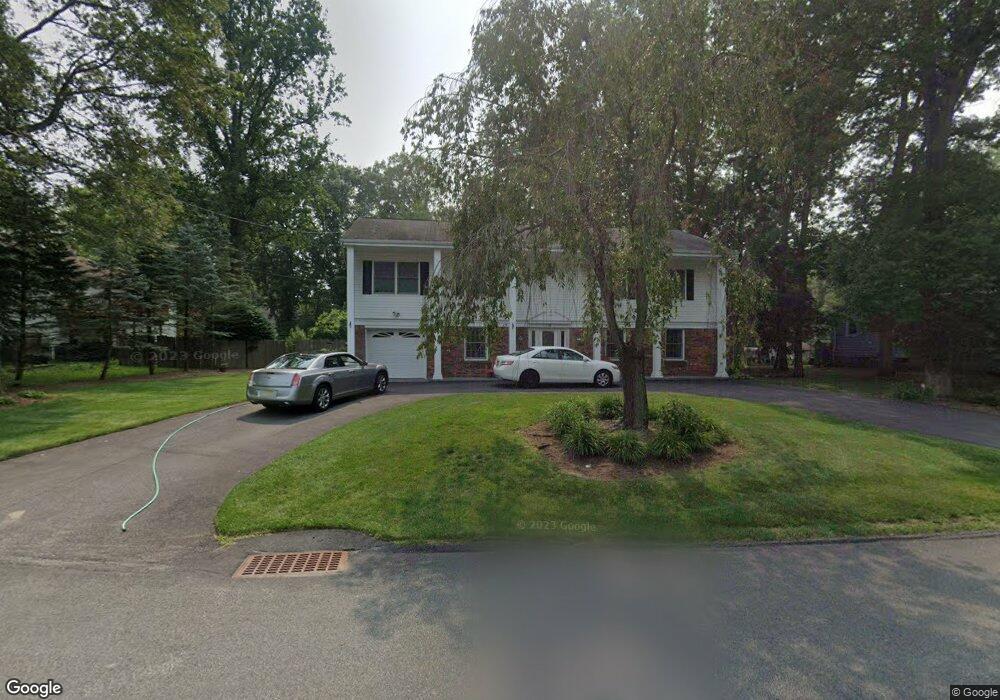
28 Charles St Stanhope, NJ 07874
Estimated Value: $485,000 - $621,827
4
Beds
3
Baths
2,640
Sq Ft
$222/Sq Ft
Est. Value
About This Home
This home is located at 28 Charles St, Stanhope, NJ 07874 and is currently estimated at $585,957, approximately $221 per square foot. 28 Charles St is a home located in Sussex County with nearby schools including Durban Avenue Elementary School, Hudson Maxim Elementary School, and Tulsa Trail Elementary School.
Ownership History
Date
Name
Owned For
Owner Type
Purchase Details
Closed on
Nov 11, 2024
Sold by
Devries Craig H and Devries Lisa Ann
Bought by
Devries Craig H
Current Estimated Value
Home Financials for this Owner
Home Financials are based on the most recent Mortgage that was taken out on this home.
Original Mortgage
$215,920
Outstanding Balance
$207,852
Interest Rate
5.25%
Mortgage Type
New Conventional
Estimated Equity
$378,105
Purchase Details
Closed on
Nov 28, 1994
Sold by
The Prudential Home Mtg Co Inc
Bought by
Devries Craig H and Devries Lisa Ann
Purchase Details
Closed on
Jul 28, 1994
Sold by
Untig Robert E
Bought by
Prudential Home Mtg Company Inc
Create a Home Valuation Report for This Property
The Home Valuation Report is an in-depth analysis detailing your home's value as well as a comparison with similar homes in the area
Home Values in the Area
Average Home Value in this Area
Purchase History
| Date | Buyer | Sale Price | Title Company |
|---|---|---|---|
| Devries Craig H | $150,000 | Amrock | |
| Devries Craig H | $150,000 | Amrock | |
| Devries Craig H | $150,000 | Amrock | |
| Devries Craig H | $141,625 | -- | |
| Prudential Home Mtg Company Inc | -- | -- |
Source: Public Records
Mortgage History
| Date | Status | Borrower | Loan Amount |
|---|---|---|---|
| Open | Devries Craig H | $215,920 | |
| Closed | Devries Craig H | $215,920 |
Source: Public Records
Tax History Compared to Growth
Tax History
| Year | Tax Paid | Tax Assessment Tax Assessment Total Assessment is a certain percentage of the fair market value that is determined by local assessors to be the total taxable value of land and additions on the property. | Land | Improvement |
|---|---|---|---|---|
| 2025 | $10,957 | $525,500 | $115,700 | $409,800 |
| 2024 | $10,193 | $525,500 | $115,700 | $409,800 |
| 2023 | $10,193 | $291,300 | $74,300 | $217,000 |
| 2022 | $9,992 | $291,300 | $74,300 | $217,000 |
| 2021 | $9,823 | $291,300 | $74,300 | $217,000 |
| 2020 | $9,721 | $291,300 | $74,300 | $217,000 |
| 2019 | $9,680 | $291,300 | $74,300 | $217,000 |
| 2018 | $9,660 | $291,300 | $74,300 | $217,000 |
| 2017 | $9,645 | $291,300 | $74,300 | $217,000 |
| 2016 | $9,665 | $291,300 | $74,300 | $217,000 |
| 2015 | $9,447 | $291,300 | $74,300 | $217,000 |
| 2014 | $9,415 | $291,300 | $74,300 | $217,000 |
Source: Public Records
Map
Nearby Homes