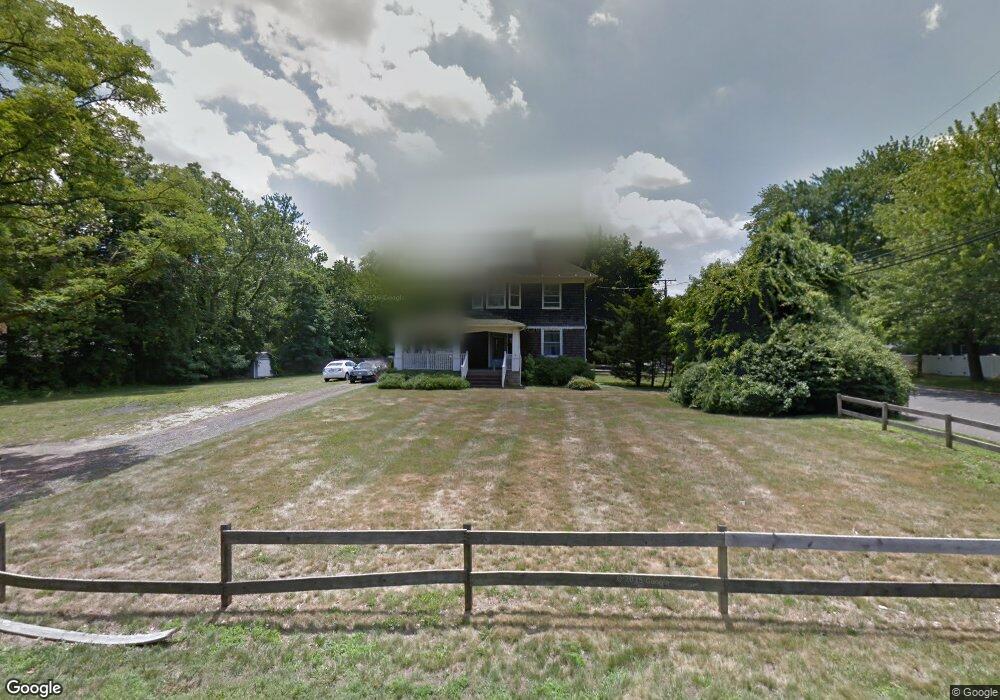
28 Cherry Tree Farm Rd Middletown, NJ 07748
New Monmouth NeighborhoodEstimated Value: $673,000 - $807,000
3
Beds
2
Baths
1,848
Sq Ft
$402/Sq Ft
Est. Value
About This Home
This home is located at 28 Cherry Tree Farm Rd, Middletown, NJ 07748 and is currently estimated at $742,510, approximately $401 per square foot. 28 Cherry Tree Farm Rd is a home located in Monmouth County with nearby schools including New Monmouth Elementary School, Thorne Middle School, and Middletown High School North.
Ownership History
Date
Name
Owned For
Owner Type
Purchase Details
Closed on
Mar 29, 2021
Sold by
Hannay James E and Hannay Jenifer M
Bought by
Hannay Jenifer M
Current Estimated Value
Purchase Details
Closed on
Nov 15, 2000
Sold by
Ham David
Bought by
Hannay James and Hannay Jennifer
Purchase Details
Closed on
May 12, 1995
Sold by
Devt Mason and Devt Jennings
Bought by
Ham David and Ham Sharon
Home Financials for this Owner
Home Financials are based on the most recent Mortgage that was taken out on this home.
Original Mortgage
$120,000
Interest Rate
8.2%
Mortgage Type
Purchase Money Mortgage
Purchase Details
Closed on
Sep 15, 1994
Sold by
Glass Keith
Bought by
Mason and Jennings
Home Financials for this Owner
Home Financials are based on the most recent Mortgage that was taken out on this home.
Original Mortgage
$160,000
Interest Rate
8.56%
Mortgage Type
Purchase Money Mortgage
Create a Home Valuation Report for This Property
The Home Valuation Report is an in-depth analysis detailing your home's value as well as a comparison with similar homes in the area
Home Values in the Area
Average Home Value in this Area
Purchase History
| Date | Buyer | Sale Price | Title Company |
|---|---|---|---|
| Hannay Jenifer M | -- | None Listed On Document | |
| Hannay James | $200,000 | -- | |
| Ham David | $160,000 | -- | |
| Mason | $200,000 | -- |
Source: Public Records
Mortgage History
| Date | Status | Borrower | Loan Amount |
|---|---|---|---|
| Previous Owner | Ham David | $120,000 | |
| Previous Owner | Mason | $160,000 |
Source: Public Records
Tax History Compared to Growth
Tax History
| Year | Tax Paid | Tax Assessment Tax Assessment Total Assessment is a certain percentage of the fair market value that is determined by local assessors to be the total taxable value of land and additions on the property. | Land | Improvement |
|---|---|---|---|---|
| 2025 | $9,758 | $681,200 | $424,800 | $256,400 |
| 2024 | $9,663 | $593,200 | $341,500 | $251,700 |
| 2023 | $9,663 | $556,000 | $329,700 | $226,300 |
| 2022 | $8,956 | $485,100 | $264,900 | $220,200 |
| 2021 | $8,956 | $430,600 | $234,800 | $195,800 |
| 2020 | $7,509 | $351,200 | $234,800 | $116,400 |
| 2019 | $7,403 | $350,500 | $234,800 | $115,700 |
| 2018 | $7,478 | $345,100 | $234,800 | $110,300 |
| 2017 | $7,678 | $361,500 | $252,500 | $109,000 |
| 2016 | $7,949 | $373,000 | $252,500 | $120,500 |
| 2015 | $7,980 | $373,600 | $252,500 | $121,100 |
| 2014 | $7,950 | $363,200 | $252,500 | $110,700 |
Source: Public Records
Map
Nearby Homes
- 1A Millbrook Dr
- 1 Millbrook Dr
- 30 Cherry Tree Farm Rd
- 2 Chanceville Place
- 32 Cherry Tree Farm Rd
- 3 Millbrook Dr
- 4 Chanceville Place
- 34 Cherry Tree Farm Rd
- 4 Millbrook Dr
- 5 Millbrook Dr
- 36 Cherry Tree Farm Rd
- 35 Cherry Tree Farm Rd
- 8 Chanceville Place
- 6 Millbrook Dr
- 2 Chanowich Ct
- 7 Millbrook Dr
- 38 Cherry Tree Farm Rd
- 411 Wilson Ave
- 10 Chanceville Place
- 7 Chanceville Place