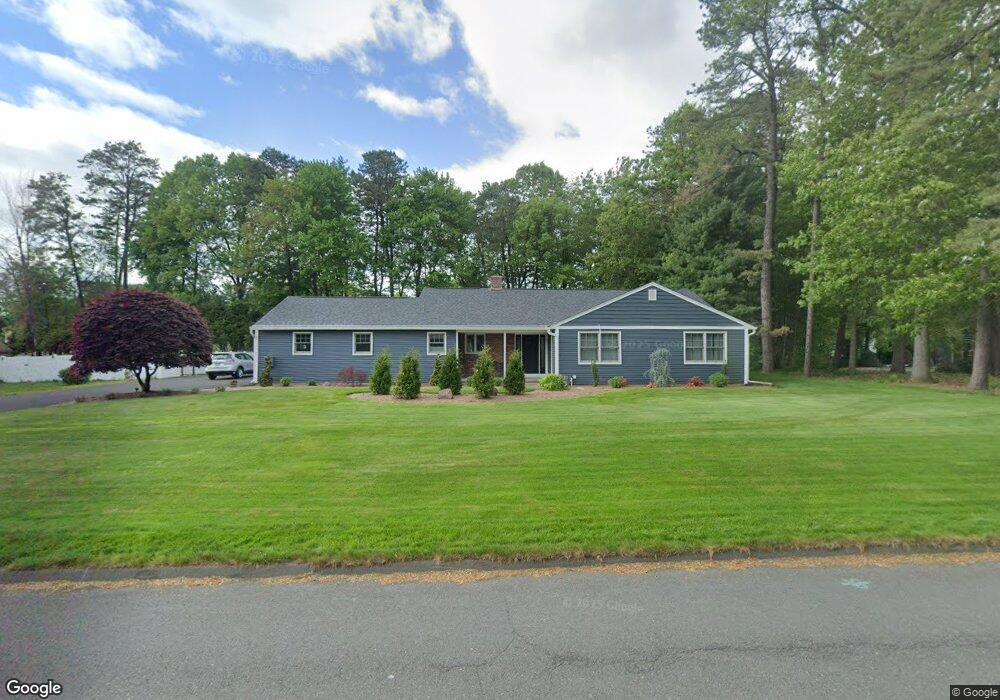
28 Christopher Dr Westfield, MA 01085
Estimated Value: $452,260 - $742,000
3
Beds
2
Baths
1,818
Sq Ft
$295/Sq Ft
Est. Value
About This Home
This home is located at 28 Christopher Dr, Westfield, MA 01085 and is currently estimated at $536,065, approximately $294 per square foot. 28 Christopher Dr is a home located in Hampden County with nearby schools including Westfield High School and Saint Mary High School.
Ownership History
Date
Name
Owned For
Owner Type
Purchase Details
Closed on
Sep 4, 1998
Sold by
Albano Michael A
Bought by
Campaniello John A and Campaniello Janice A
Current Estimated Value
Home Financials for this Owner
Home Financials are based on the most recent Mortgage that was taken out on this home.
Original Mortgage
$125,000
Outstanding Balance
$26,702
Interest Rate
6.9%
Mortgage Type
Purchase Money Mortgage
Estimated Equity
$509,363
Create a Home Valuation Report for This Property
The Home Valuation Report is an in-depth analysis detailing your home's value as well as a comparison with similar homes in the area
Home Values in the Area
Average Home Value in this Area
Purchase History
| Date | Buyer | Sale Price | Title Company |
|---|---|---|---|
| Campaniello John A | $186,000 | -- |
Source: Public Records
Mortgage History
| Date | Status | Borrower | Loan Amount |
|---|---|---|---|
| Open | Campaniello John A | $53,400 | |
| Open | Campaniello John A | $125,000 |
Source: Public Records
Tax History Compared to Growth
Tax History
| Year | Tax Paid | Tax Assessment Tax Assessment Total Assessment is a certain percentage of the fair market value that is determined by local assessors to be the total taxable value of land and additions on the property. | Land | Improvement |
|---|---|---|---|---|
| 2025 | $5,653 | $372,400 | $137,100 | $235,300 |
| 2024 | $5,759 | $360,600 | $125,300 | $235,300 |
| 2023 | $5,349 | $325,900 | $119,000 | $206,900 |
| 2022 | $5,349 | $289,300 | $106,000 | $183,300 |
| 2021 | $5,181 | $274,400 | $99,700 | $174,700 |
| 2020 | $5,203 | $270,300 | $99,700 | $170,600 |
| 2019 | $5,096 | $259,100 | $95,300 | $163,800 |
| 2018 | $5,016 | $259,100 | $95,300 | $163,800 |
| 2017 | $5,214 | $268,500 | $96,500 | $172,000 |
| 2016 | $5,220 | $268,500 | $96,500 | $172,000 |
| 2015 | $5,102 | $275,200 | $96,500 | $178,700 |
| 2014 | $3,818 | $275,200 | $96,500 | $178,700 |
Source: Public Records
Map
Nearby Homes
- 242 Eastwood Dr
- 120 Woodcliff Dr
- 99 Hillcrest Cir
- 346 E Mountain Rd
- 0 Holyoke Rd
- 26 Deepwoods Dr
- 0 Little River Road ( Rear )
- 14 Lynnwood Dr
- 119 Union St Unit 4
- 111 Union St Unit 6
- 0 E Mountain Rd
- 99 Woodmont St
- 13 William St
- 138 Main St Unit 13
- 138 Main St Unit 11
- 20 Greenwood St Unit 10
- 72-74 Notre Dame St
- 103 Feeding Hills Rd
- 0 Feeding Hills Rd
- 351 N Elm St
- 22 Christopher Dr
- 32 Christopher Dr
- 53 Briarcliff Dr
- 37 Salvator Dr
- 29 Salvator Dr
- 16 Christopher Dr
- 52 Briarcliff Dr
- 35 Christopher Dr
- 41 Salvator Dr
- 21 Salvator Dr
- 49 Briarcliff Dr
- 15 Christopher Dr
- 12 Christopher Dr
- 48 Briarcliff Dr
- 40 Christopher Dr
- 45 Briarcliff Dr
- 11 Christopher Dr
- 15 Salvator Dr
- 47 Salvator Dr
- 51 Marla Cir