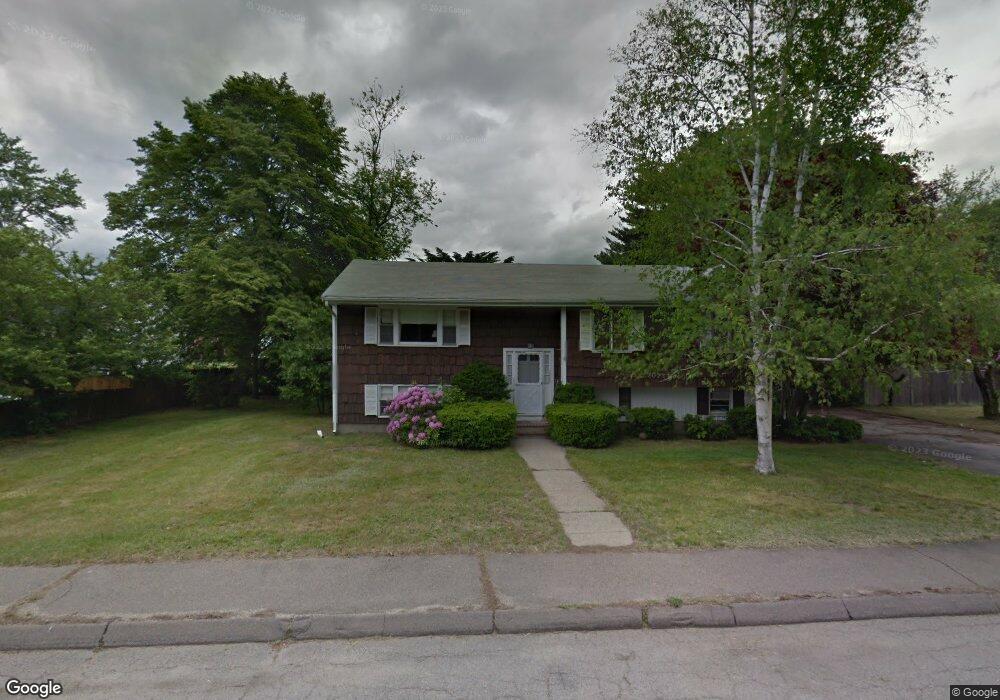
28 Clark St Randolph, MA 02368
North Randolph NeighborhoodEstimated Value: $562,374 - $746,000
6
Beds
2
Baths
1,200
Sq Ft
$561/Sq Ft
Est. Value
About This Home
This home is located at 28 Clark St, Randolph, MA 02368 and is currently estimated at $673,094, approximately $560 per square foot. 28 Clark St is a home located in Norfolk County with nearby schools including Randolph High School and Lighthouse Baptist Christian Academy.
Ownership History
Date
Name
Owned For
Owner Type
Purchase Details
Closed on
Sep 10, 2019
Sold by
John Girdvainis 2010 T
Bought by
Thompson Cheryl
Current Estimated Value
Purchase Details
Closed on
Oct 4, 2016
Sold by
Girdvainis John J
Bought by
John Giravainis 2010 T
Purchase Details
Closed on
Apr 19, 2012
Sold by
Thompson Cheryl M
Bought by
Girdvainis John
Purchase Details
Closed on
Nov 19, 2010
Sold by
Thompson Edward F and Thompson Cheryl M
Bought by
Thompson Cheryl M
Purchase Details
Closed on
May 24, 1991
Sold by
Goldman Robert S
Bought by
Thompson Edward F
Home Financials for this Owner
Home Financials are based on the most recent Mortgage that was taken out on this home.
Original Mortgage
$153,000
Interest Rate
9.36%
Mortgage Type
Purchase Money Mortgage
Create a Home Valuation Report for This Property
The Home Valuation Report is an in-depth analysis detailing your home's value as well as a comparison with similar homes in the area
Home Values in the Area
Average Home Value in this Area
Purchase History
| Date | Buyer | Sale Price | Title Company |
|---|---|---|---|
| Thompson Cheryl | $300,000 | -- | |
| John Giravainis 2010 T | -- | -- | |
| Girdvainis John | $200,000 | -- | |
| Thompson Cheryl M | -- | -- | |
| Thompson Edward F | $170,000 | -- |
Source: Public Records
Mortgage History
| Date | Status | Borrower | Loan Amount |
|---|---|---|---|
| Previous Owner | Thompson Edward F | $128,000 | |
| Previous Owner | Thompson Edward F | $161,100 | |
| Previous Owner | Thompson Edward F | $18,229 | |
| Previous Owner | Thompson Edward F | $153,000 |
Source: Public Records
Tax History Compared to Growth
Tax History
| Year | Tax Paid | Tax Assessment Tax Assessment Total Assessment is a certain percentage of the fair market value that is determined by local assessors to be the total taxable value of land and additions on the property. | Land | Improvement |
|---|---|---|---|---|
| 2025 | $6,496 | $559,500 | $231,000 | $328,500 |
| 2024 | $6,027 | $526,400 | $226,500 | $299,900 |
| 2023 | $5,638 | $466,700 | $205,900 | $260,800 |
| 2022 | $5,562 | $409,000 | $171,600 | $237,400 |
| 2021 | $5,807 | $392,900 | $143,000 | $249,900 |
| 2020 | $5,569 | $373,500 | $143,000 | $230,500 |
| 2019 | $5,265 | $351,500 | $136,200 | $215,300 |
| 2018 | $4,721 | $297,300 | $123,800 | $173,500 |
| 2017 | $4,712 | $291,200 | $117,900 | $173,300 |
| 2016 | $4,387 | $252,300 | $107,200 | $145,100 |
| 2015 | $4,183 | $231,100 | $102,000 | $129,100 |
Source: Public Records
Map
Nearby Homes
- 1 Clark Cir
- 44 Liberty St
- 591 N Main St
- 33 Liberty St
- 34 Orchard St
- 73 Belcher St
- 12 Jasper Ln Unit 12
- 16 Simmonds Blvd Unit 16
- 20 Simmonds Blvd Unit 20
- 14 Simmonds Blvd Unit 14
- 12 Simmonds Blvd Unit 12
- 18 Jasper Ln
- 54 Jasper Ln
- 26 Knights Crescent St
- 7 Webster St
- 20 Nelson Dr Unit 3A
- 38 Mcdevitt Rd
- 469 North St
- 12 Webster St
- 47 West St Unit A2