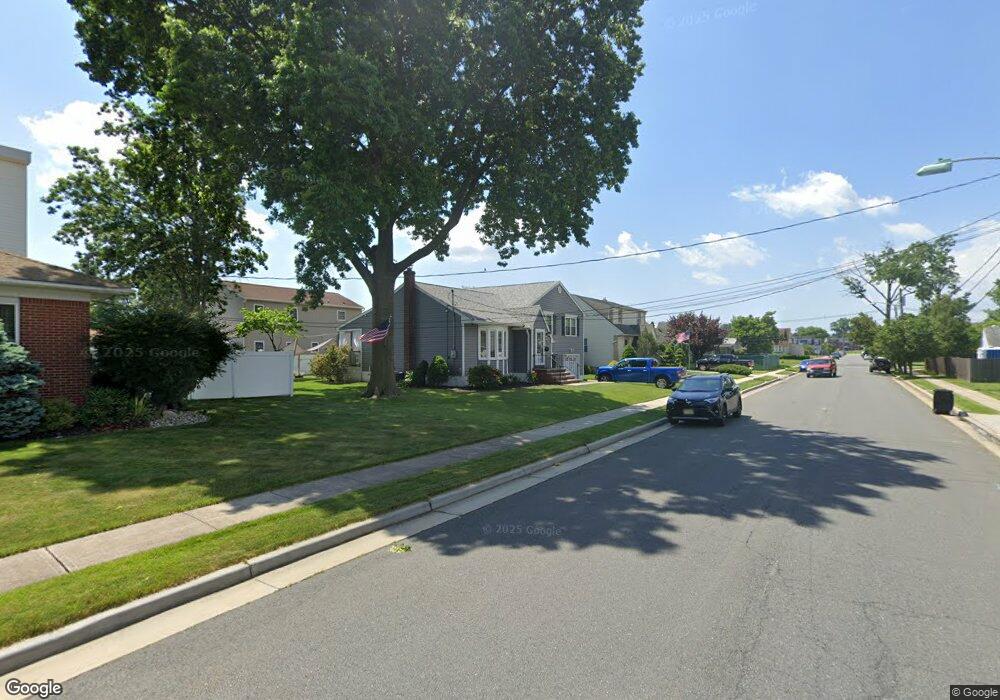
28 Clifford St Carteret, NJ 07008
Estimated Value: $539,211 - $605,000
3
Beds
2
Baths
1,546
Sq Ft
$367/Sq Ft
Est. Value
About This Home
This home is located at 28 Clifford St, Carteret, NJ 07008 and is currently estimated at $566,803, approximately $366 per square foot. 28 Clifford St is a home located in Middlesex County with nearby schools including Carteret High School and St Joseph School.
Ownership History
Date
Name
Owned For
Owner Type
Purchase Details
Closed on
Jan 22, 2009
Sold by
Bohanek Barbara
Bought by
Seufert Vincent J and Cordova Janira N
Current Estimated Value
Home Financials for this Owner
Home Financials are based on the most recent Mortgage that was taken out on this home.
Original Mortgage
$224,000
Outstanding Balance
$144,063
Interest Rate
5.51%
Mortgage Type
Purchase Money Mortgage
Estimated Equity
$422,740
Create a Home Valuation Report for This Property
The Home Valuation Report is an in-depth analysis detailing your home's value as well as a comparison with similar homes in the area
Home Values in the Area
Average Home Value in this Area
Purchase History
| Date | Buyer | Sale Price | Title Company |
|---|---|---|---|
| Seufert Vincent J | $280,000 | East Coast Title Agency |
Source: Public Records
Mortgage History
| Date | Status | Borrower | Loan Amount |
|---|---|---|---|
| Open | Seufert Vincent J | $224,000 |
Source: Public Records
Tax History Compared to Growth
Tax History
| Year | Tax Paid | Tax Assessment Tax Assessment Total Assessment is a certain percentage of the fair market value that is determined by local assessors to be the total taxable value of land and additions on the property. | Land | Improvement |
|---|---|---|---|---|
| 2025 | $8,869 | $611,000 | $354,500 | $256,500 |
| 2024 | $8,641 | $278,200 | $132,500 | $145,700 |
| 2023 | $8,641 | $278,200 | $132,500 | $145,700 |
| 2022 | $8,402 | $278,200 | $132,500 | $145,700 |
| 2021 | $6,157 | $278,200 | $132,500 | $145,700 |
| 2020 | $8,001 | $278,200 | $132,500 | $145,700 |
| 2019 | $7,770 | $278,200 | $132,500 | $145,700 |
| 2018 | $7,587 | $278,200 | $132,500 | $145,700 |
| 2017 | $7,317 | $278,200 | $132,500 | $145,700 |
| 2016 | $6,765 | $213,600 | $102,500 | $111,100 |
| 2015 | $6,666 | $213,600 | $102,500 | $111,100 |
| 2014 | $6,376 | $213,600 | $102,500 | $111,100 |
Source: Public Records
Map
Nearby Homes