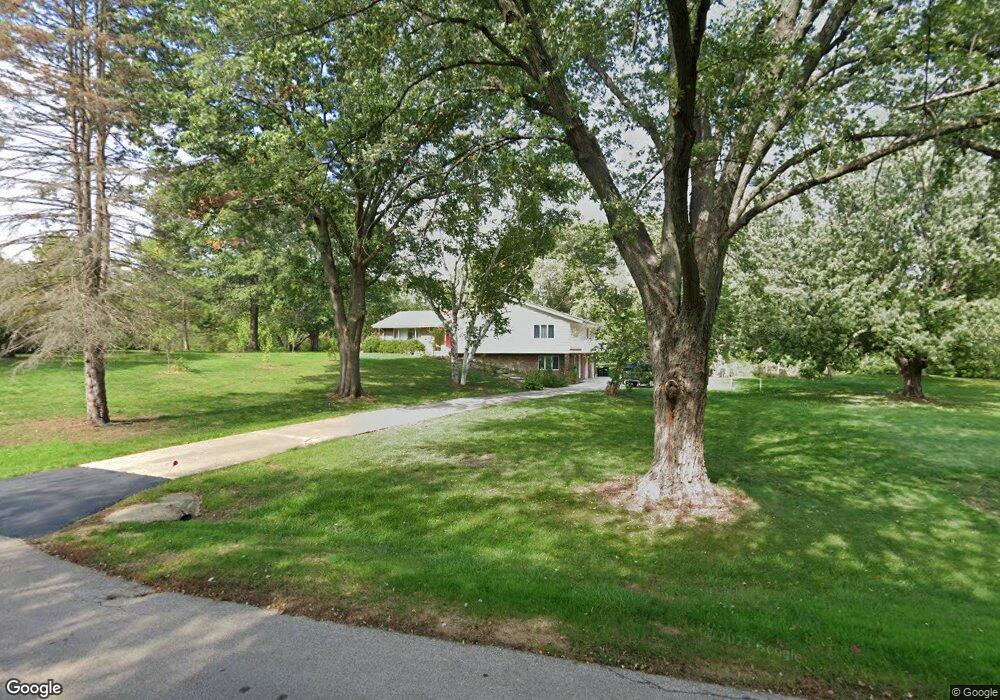
28 Covered Bridge Rd South Barrington, IL 60010
Estimated Value: $641,000 - $780,199
4
Beds
3
Baths
2,636
Sq Ft
$264/Sq Ft
Est. Value
About This Home
This home is located at 28 Covered Bridge Rd, South Barrington, IL 60010 and is currently estimated at $695,550, approximately $263 per square foot. 28 Covered Bridge Rd is a home located in Cook County with nearby schools including Barbara B. Rose Elementary School, Barrington Middle School Station Campus, and Barrington High School.
Ownership History
Date
Name
Owned For
Owner Type
Purchase Details
Closed on
Apr 26, 2019
Sold by
Harry O Swenson & Va G Swenson Joint Rev
Bought by
Haljiti Jusuf and Haljiti Sevala
Current Estimated Value
Home Financials for this Owner
Home Financials are based on the most recent Mortgage that was taken out on this home.
Original Mortgage
$290,400
Outstanding Balance
$255,320
Interest Rate
4.2%
Mortgage Type
New Conventional
Estimated Equity
$440,230
Purchase Details
Closed on
Jul 15, 2015
Sold by
Swenson Virginia G
Bought by
The Harry O Swenson Joint Revocable Trus
Purchase Details
Closed on
Aug 5, 2005
Sold by
Swenson Harry O and Swenson Virginia G
Bought by
Swenson Virginia G and Virginia G Swenson Revocable Trust
Create a Home Valuation Report for This Property
The Home Valuation Report is an in-depth analysis detailing your home's value as well as a comparison with similar homes in the area
Home Values in the Area
Average Home Value in this Area
Purchase History
| Date | Buyer | Sale Price | Title Company |
|---|---|---|---|
| Haljiti Jusuf | $363,000 | Attorneys Ttl Guaranty Fund | |
| The Harry O Swenson Joint Revocable Trus | -- | Attorney | |
| Swenson Virginia G | -- | -- |
Source: Public Records
Mortgage History
| Date | Status | Borrower | Loan Amount |
|---|---|---|---|
| Open | Haljiti Jusuf | $290,400 |
Source: Public Records
Tax History Compared to Growth
Tax History
| Year | Tax Paid | Tax Assessment Tax Assessment Total Assessment is a certain percentage of the fair market value that is determined by local assessors to be the total taxable value of land and additions on the property. | Land | Improvement |
|---|---|---|---|---|
| 2024 | $12,026 | $56,376 | $31,376 | $25,000 |
| 2023 | $11,668 | $56,376 | $31,376 | $25,000 |
| 2022 | $11,668 | $56,376 | $31,376 | $25,000 |
| 2021 | $7,299 | $32,670 | $20,917 | $11,753 |
| 2020 | $7,121 | $32,670 | $20,917 | $11,753 |
| 2019 | $6,956 | $36,300 | $20,917 | $15,383 |
| 2018 | $11,849 | $54,410 | $18,302 | $36,108 |
| 2017 | $11,452 | $60,116 | $18,302 | $41,814 |
| 2016 | $11,155 | $60,116 | $18,302 | $41,814 |
| 2015 | $10,316 | $52,254 | $15,688 | $36,566 |
| 2014 | $11,223 | $52,254 | $15,688 | $36,566 |
| 2013 | $4,956 | $52,254 | $15,688 | $36,566 |
Source: Public Records
Map
Nearby Homes
- 23 Polo Dr
- 40 Polo Dr
- 8 Falcon Lakes Dr
- 14 E Penny Rd
- 8 Stone Ridge Dr
- 17 Heath Way
- 45 Willow Bay Dr
- 34 Abbey Woods Dr
- 29 Abbey Woods Dr
- 303 Algonquin Rd
- Lot 4 E Mundhank Rd
- 1980 Dogwood Dr
- 3 Shoreside Dr
- 1120 Ashley Ln
- 33 N Liberty Dr
- 10 Shoreside Dr
- 1860 Burr Ridge Dr
- 1115 Ashley Ln
- 16 Forest Ln
- 3 Leanda Ln
- 24 Covered Bridge Rd
- 32 Covered Bridge Rd
- 23 Covered Bridge Rd
- 27 Overbrook Rd Unit 6
- 20 Covered Bridge Rd
- 31 Covered Bridge Rd
- 36 Covered Bridge Rd Unit 1
- 23 Overbrook Rd
- 17 Overbrook Rd
- 31 Overbrook Rd
- 37 Covered Bridge Rd
- 16 Covered Bridge Rd
- 13 Overbrook Rd
- 37 Overbrook Rd
- 42 Covered Bridge Rd Unit 1
- 53 Covered Bridge Rd
- 16 Buckthorn Rd
- 4 Buckthorn Rd
- 6 Buckthorn Rd Unit 1
- 15 Covered Bridge Rd