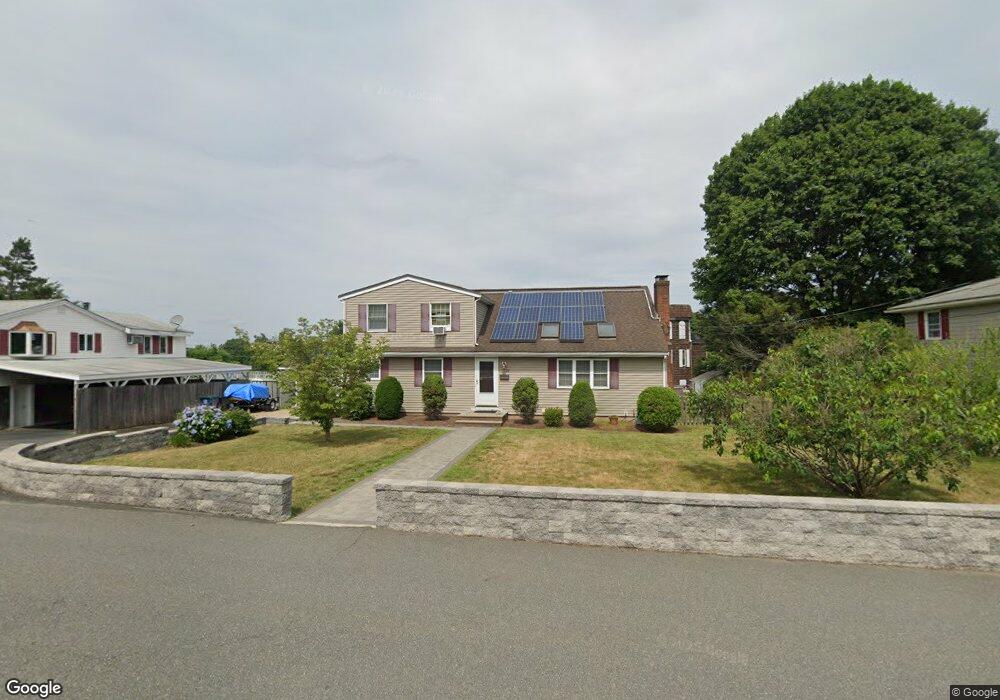
28 Crowdis St Salem, MA 01970
Witchcraft Heights NeighborhoodEstimated Value: $698,041 - $829,000
4
Beds
3
Baths
1,689
Sq Ft
$444/Sq Ft
Est. Value
About This Home
This home is located at 28 Crowdis St, Salem, MA 01970 and is currently estimated at $750,260, approximately $444 per square foot. 28 Crowdis St is a home located in Essex County with nearby schools including Horace Mann Laboratory, Witchcraft Heights Elementary School, and Saltonstall School.
Ownership History
Date
Name
Owned For
Owner Type
Purchase Details
Closed on
Mar 3, 2006
Sold by
Rocheville Janis M and Rocheville Scott M
Bought by
Dalessandro Colleen M
Current Estimated Value
Home Financials for this Owner
Home Financials are based on the most recent Mortgage that was taken out on this home.
Original Mortgage
$460,000
Outstanding Balance
$259,819
Interest Rate
6.16%
Mortgage Type
Purchase Money Mortgage
Estimated Equity
$490,441
Purchase Details
Closed on
Oct 26, 1993
Sold by
Tavis Elaine M and Tavis Mary
Bought by
Rocheville Scott M
Create a Home Valuation Report for This Property
The Home Valuation Report is an in-depth analysis detailing your home's value as well as a comparison with similar homes in the area
Home Values in the Area
Average Home Value in this Area
Purchase History
| Date | Buyer | Sale Price | Title Company |
|---|---|---|---|
| Dalessandro Colleen M | $380,000 | -- | |
| Rocheville Scott M | $135,000 | -- |
Source: Public Records
Mortgage History
| Date | Status | Borrower | Loan Amount |
|---|---|---|---|
| Open | Rocheville Scott M | $192,200 | |
| Open | Rocheville Scott M | $460,000 |
Source: Public Records
Tax History Compared to Growth
Tax History
| Year | Tax Paid | Tax Assessment Tax Assessment Total Assessment is a certain percentage of the fair market value that is determined by local assessors to be the total taxable value of land and additions on the property. | Land | Improvement |
|---|---|---|---|---|
| 2025 | $6,850 | $604,100 | $242,000 | $362,100 |
| 2024 | $6,480 | $557,700 | $228,400 | $329,300 |
| 2023 | $6,444 | $515,100 | $207,900 | $307,200 |
| 2022 | $6,107 | $460,900 | $190,900 | $270,000 |
| 2021 | $5,808 | $420,900 | $177,300 | $243,600 |
| 2020 | $6,042 | $418,100 | $173,900 | $244,200 |
| 2019 | $5,987 | $396,500 | $163,600 | $232,900 |
| 2018 | $5,485 | $356,600 | $152,700 | $203,900 |
| 2017 | $5,505 | $347,100 | $143,200 | $203,900 |
| 2016 | $5,439 | $347,100 | $143,200 | $203,900 |
| 2015 | $5,168 | $314,900 | $126,100 | $188,800 |
Source: Public Records
Map
Nearby Homes
- 36 Valley St
- 38 Valley St
- 119 Highland Ave
- 2 Hillside Ave
- 36 Summit St
- 25 Outlook Ave
- 23 Proctor St
- 29 Willson St
- 15 Wall St
- 57 Ord St
- 10 Horton St
- 176 Marlborough Rd
- 1 Laurent Rd Unit 3
- 159 Marlborough Rd
- 46 Sutton St
- 35 First St Unit A
- 25 Calabrese St
- 55 Butler St
- 11 Osborne Hill Dr
- 263 Jefferson Ave