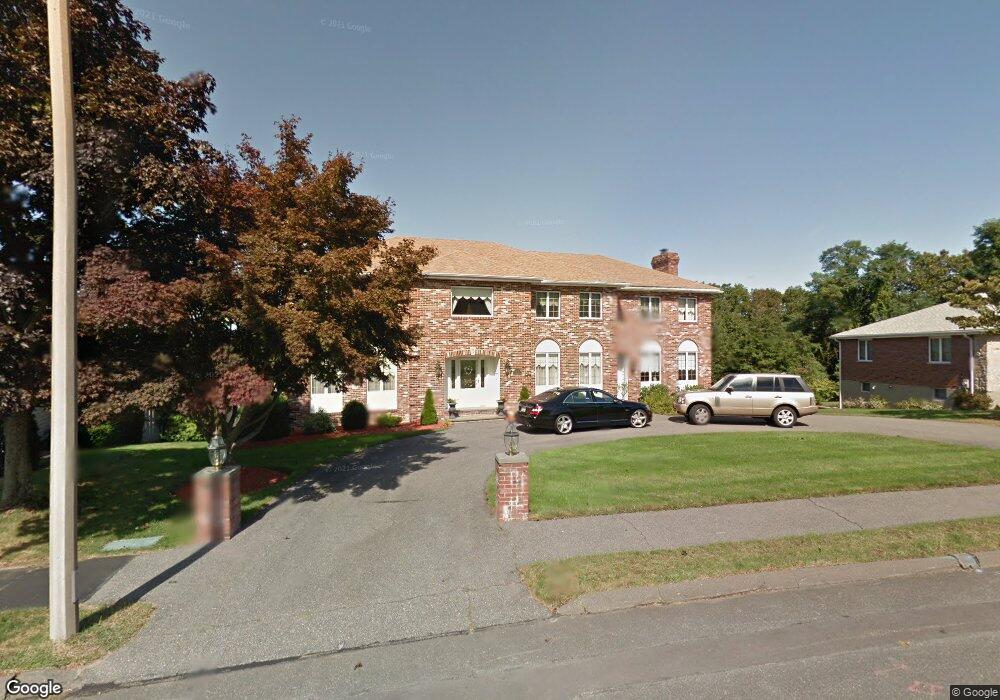
28 Crystal Dr Stoneham, MA 02180
Colonial Park NeighborhoodEstimated Value: $1,353,375 - $1,574,000
4
Beds
3
Baths
4,042
Sq Ft
$353/Sq Ft
Est. Value
About This Home
This home is located at 28 Crystal Dr, Stoneham, MA 02180 and is currently estimated at $1,427,094, approximately $353 per square foot. 28 Crystal Dr is a home located in Middlesex County with nearby schools including Stoneham High School, St. Patrick Elementary School, and Greater Boston Academy.
Ownership History
Date
Name
Owned For
Owner Type
Purchase Details
Closed on
Nov 1, 2010
Sold by
Crystal Rt
Bought by
Bennett Diane and Bennett David
Current Estimated Value
Home Financials for this Owner
Home Financials are based on the most recent Mortgage that was taken out on this home.
Original Mortgage
$325,000
Outstanding Balance
$215,738
Interest Rate
4.39%
Mortgage Type
Purchase Money Mortgage
Estimated Equity
$1,211,356
Create a Home Valuation Report for This Property
The Home Valuation Report is an in-depth analysis detailing your home's value as well as a comparison with similar homes in the area
Home Values in the Area
Average Home Value in this Area
Purchase History
| Date | Buyer | Sale Price | Title Company |
|---|---|---|---|
| Bennett Diane | -- | -- |
Source: Public Records
Mortgage History
| Date | Status | Borrower | Loan Amount |
|---|---|---|---|
| Open | Bennett Diane | $325,000 |
Source: Public Records
Tax History
| Year | Tax Paid | Tax Assessment Tax Assessment Total Assessment is a certain percentage of the fair market value that is determined by local assessors to be the total taxable value of land and additions on the property. | Land | Improvement |
|---|---|---|---|---|
| 2025 | $13,540 | $1,323,600 | $423,400 | $900,200 |
| 2024 | $13,066 | $1,233,800 | $403,400 | $830,400 |
| 2023 | $12,653 | $1,139,900 | $363,400 | $776,500 |
| 2022 | $11,177 | $1,073,700 | $343,400 | $730,300 |
| 2021 | $11,013 | $1,017,800 | $303,400 | $714,400 |
| 2020 | $10,817 | $1,002,500 | $303,400 | $699,100 |
| 2019 | $10,639 | $948,200 | $273,400 | $674,800 |
| 2018 | $10,580 | $903,500 | $263,400 | $640,100 |
| 2017 | $10,269 | $828,800 | $233,400 | $595,400 |
| 2016 | $10,321 | $812,700 | $233,400 | $579,300 |
| 2015 | $10,266 | $792,100 | $233,400 | $558,700 |
| 2014 | $10,410 | $771,700 | $223,400 | $548,300 |
Source: Public Records
Map
Nearby Homes
- 9 Lovis Ave
- 12 Lovis Ave
- 824 Main St Unit 1
- 15 Brookbridge Rd
- 15 Hickory Hill Rd
- 3 Valley Rd
- 11 Ludlow Ave
- 1 Sidney St
- 39 Tamarock Terrace
- 81 Spring St
- 51 Spring St
- 55 Bartley St
- 252 Albion St Unit 3
- 33 Lake Ave
- 6 Sherman Rd
- 58 Washington St
- 69 Foundry St Unit 310
- 69 Foundry St Unit 416
- 248 Albion St Unit 231
- 248 Albion St Unit 321
Your Personal Tour Guide
Ask me questions while you tour the home.