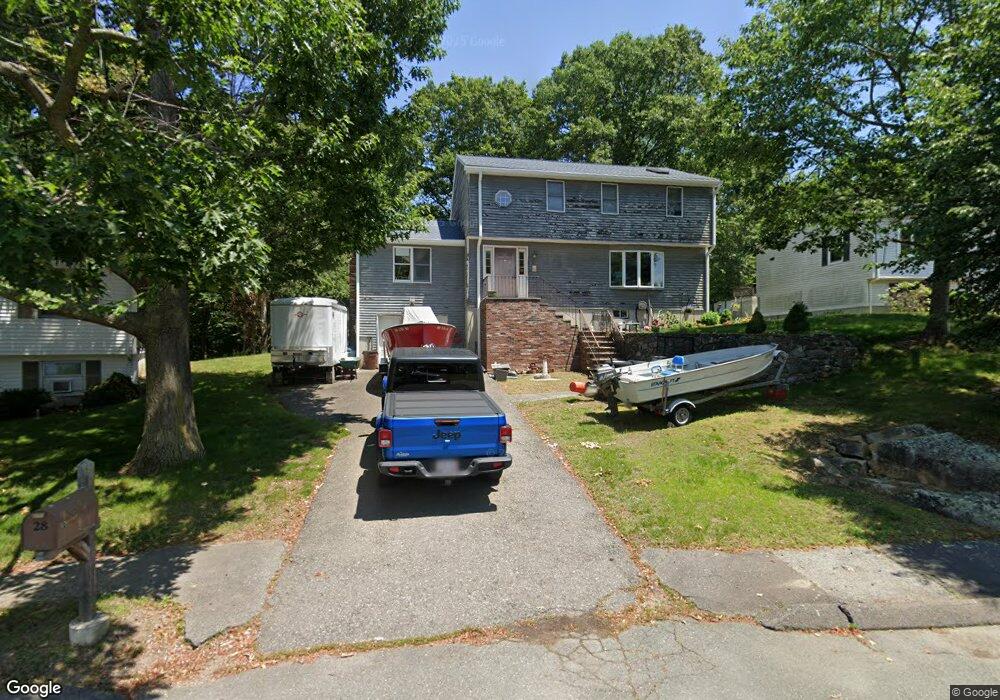
28 Daigle Rd Lynn, MA 01904
Fays Estate NeighborhoodEstimated Value: $761,172 - $862,000
3
Beds
2
Baths
2,138
Sq Ft
$373/Sq Ft
Est. Value
About This Home
This home is located at 28 Daigle Rd, Lynn, MA 01904 and is currently estimated at $796,543, approximately $372 per square foot. 28 Daigle Rd is a home located in Essex County with nearby schools including Aborn Elementary School, William R. Fallon School, and Pickering Middle School.
Ownership History
Date
Name
Owned For
Owner Type
Purchase Details
Closed on
Dec 14, 1994
Sold by
Saugus Coop Bank
Bought by
Lamphear William C and Lanphear Deborah
Current Estimated Value
Home Financials for this Owner
Home Financials are based on the most recent Mortgage that was taken out on this home.
Original Mortgage
$128,000
Interest Rate
9.03%
Mortgage Type
Purchase Money Mortgage
Purchase Details
Closed on
Mar 9, 1994
Sold by
Lavino Joseph
Bought by
Saugus Coop Bank
Purchase Details
Closed on
Nov 7, 1988
Sold by
Gates Robert E
Bought by
Lavino Joseph
Home Financials for this Owner
Home Financials are based on the most recent Mortgage that was taken out on this home.
Original Mortgage
$160,000
Interest Rate
10.33%
Mortgage Type
Purchase Money Mortgage
Create a Home Valuation Report for This Property
The Home Valuation Report is an in-depth analysis detailing your home's value as well as a comparison with similar homes in the area
Home Values in the Area
Average Home Value in this Area
Purchase History
| Date | Buyer | Sale Price | Title Company |
|---|---|---|---|
| Lamphear William C | $160,000 | -- | |
| Lamphear William C | $160,000 | -- | |
| Saugus Coop Bank | $135,000 | -- | |
| Lavino Joseph | $218,000 | -- |
Source: Public Records
Mortgage History
| Date | Status | Borrower | Loan Amount |
|---|---|---|---|
| Closed | Lavino Joseph | $128,000 | |
| Previous Owner | Lavino Joseph | $13,138 | |
| Previous Owner | Lavino Joseph | $160,000 | |
| Closed | Lamphear William C | $0 |
Source: Public Records
Tax History
| Year | Tax Paid | Tax Assessment Tax Assessment Total Assessment is a certain percentage of the fair market value that is determined by local assessors to be the total taxable value of land and additions on the property. | Land | Improvement |
|---|---|---|---|---|
| 2025 | $7,706 | $743,800 | $230,600 | $513,200 |
| 2024 | $7,454 | $707,900 | $221,100 | $486,800 |
| 2023 | $7,113 | $637,900 | $210,100 | $427,800 |
| 2022 | $7,052 | $567,300 | $175,100 | $392,200 |
| 2021 | $6,548 | $502,500 | $159,000 | $343,500 |
| 2020 | $6,582 | $491,200 | $162,600 | $328,600 |
| 2019 | $6,584 | $460,400 | $155,100 | $305,300 |
| 2018 | $6,324 | $417,400 | $151,600 | $265,800 |
| 2017 | $6,040 | $387,200 | $135,100 | $252,100 |
| 2016 | $5,720 | $353,500 | $116,500 | $237,000 |
| 2015 | $5,524 | $329,800 | $115,000 | $214,800 |
Source: Public Records
Map
Nearby Homes
- 38 Ledgemont Ln
- 73 Lockwood Rd
- 31 Atkins Ave
- 21 E Park Ave
- 22 Strongwater Dr
- 11 Urban St
- 18 Kittredge St
- 91 Oakwood Ave
- 18 Strongwater Dr
- 19 Gage St
- 11 Strongwater Dr
- 431-433 Chatham St
- 10 Fairview Rd
- 6A Goodridge St
- 27-29 Graves Ave
- 16 Clinton St
- 40 Archer St
- 16 Sunset Dr
- 16 Isabella St
- 100 Magnolia Ave Unit 5
Your Personal Tour Guide
Ask me questions while you tour the home.