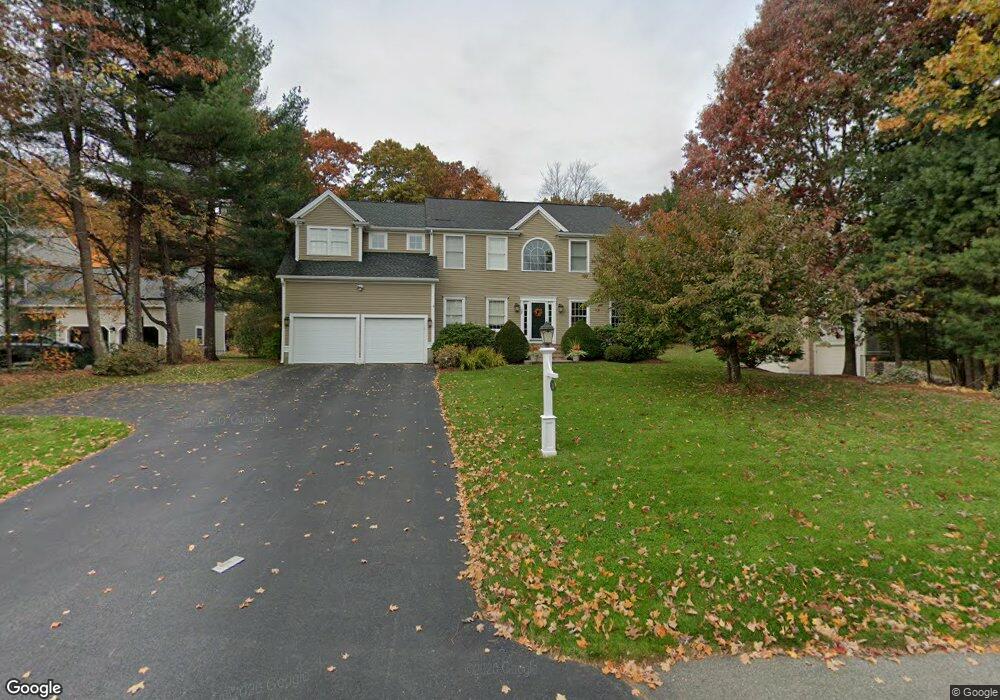
28 Darlene Dr Southborough, MA 01772
Estimated Value: $1,290,586 - $1,409,000
4
Beds
4
Baths
3,395
Sq Ft
$399/Sq Ft
Est. Value
About This Home
This home is located at 28 Darlene Dr, Southborough, MA 01772 and is currently estimated at $1,353,147, approximately $398 per square foot. 28 Darlene Dr is a home located in Worcester County with nearby schools including Albert S. Woodward Memorial School, Margaret A. Neary School, and P. Brent Trottier Middle School.
Ownership History
Date
Name
Owned For
Owner Type
Purchase Details
Closed on
Sep 8, 1995
Sold by
Macgregor Cecil and Ayuso Damaris
Bought by
Polutchko Robert and Harragan Kathleen
Current Estimated Value
Purchase Details
Closed on
Jun 27, 1994
Sold by
Barberry Homes Inc
Bought by
Macgregor Cecil D and Ayuso Damaris
Create a Home Valuation Report for This Property
The Home Valuation Report is an in-depth analysis detailing your home's value as well as a comparison with similar homes in the area
Home Values in the Area
Average Home Value in this Area
Purchase History
| Date | Buyer | Sale Price | Title Company |
|---|---|---|---|
| Polutchko Robert | $360,000 | -- | |
| Macgregor Cecil D | $346,350 | -- |
Source: Public Records
Mortgage History
| Date | Status | Borrower | Loan Amount |
|---|---|---|---|
| Open | Macgregor Cecil D | $416,500 | |
| Closed | Macgregor Cecil D | $267,000 | |
| Closed | Macgregor Cecil D | $268,000 |
Source: Public Records
Tax History Compared to Growth
Tax History
| Year | Tax Paid | Tax Assessment Tax Assessment Total Assessment is a certain percentage of the fair market value that is determined by local assessors to be the total taxable value of land and additions on the property. | Land | Improvement |
|---|---|---|---|---|
| 2025 | $15,471 | $1,120,300 | $370,600 | $749,700 |
| 2024 | $14,459 | $1,039,500 | $356,100 | $683,400 |
| 2023 | $13,712 | $929,000 | $338,800 | $590,200 |
| 2022 | $13,358 | $820,500 | $294,500 | $526,000 |
| 2021 | $12,812 | $790,400 | $285,000 | $505,400 |
| 2020 | $12,757 | $765,700 | $276,300 | $489,400 |
| 2019 | $12,568 | $750,800 | $276,300 | $474,500 |
| 2018 | $11,860 | $734,800 | $276,300 | $458,500 |
| 2017 | $11,789 | $719,700 | $276,300 | $443,400 |
| 2016 | $11,545 | $729,800 | $287,200 | $442,600 |
| 2015 | $11,368 | $709,600 | $272,600 | $437,000 |
Source: Public Records
Map
Nearby Homes
- 23 Stonebrook Ct Unit 11
- 43 Edgewood Rd
- 20 Southville Rd
- 2 Aikens Rd
- 22 Irene Cir
- 35 Lincoln St
- 37 Lincoln St
- 0 Oak St
- 8 Lorenzo Dr
- 262 Parkerville Rd
- 0 Cordaville Rd
- 3 Candlewood Ln
- 19 Gilmore Rd
- 2 Fairview Dr
- 71 Weston Ln Unit 71
- 17 Highcroft Way
- 34 Waterville Ln Unit 34
- 36 Waterville Ln Unit 36
- 38 Waterville Ln Unit 38
- 30 Waterville Ln Unit 30