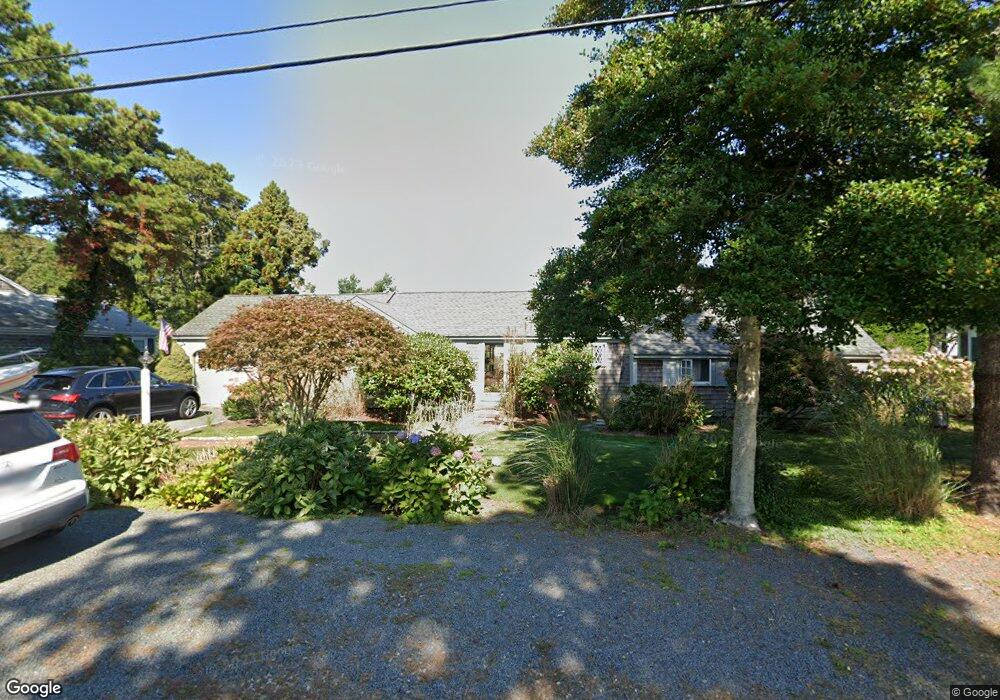
28 Davenport Rd West Dennis, MA 02670
West Dennis NeighborhoodEstimated Value: $1,067,000 - $1,416,190
3
Beds
3
Baths
2,067
Sq Ft
$613/Sq Ft
Est. Value
About This Home
This home is located at 28 Davenport Rd, West Dennis, MA 02670 and is currently estimated at $1,267,298, approximately $613 per square foot. 28 Davenport Rd is a home located in Barnstable County with nearby schools including Dennis-Yarmouth Regional High School and St. Pius X. School.
Ownership History
Date
Name
Owned For
Owner Type
Purchase Details
Closed on
Mar 31, 2011
Sold by
Muriel D Lee 2007 Ret and Boland Maureen L
Bought by
Sturdy Mark E and Sturdy Kerrin L
Current Estimated Value
Home Financials for this Owner
Home Financials are based on the most recent Mortgage that was taken out on this home.
Original Mortgage
$300,000
Outstanding Balance
$209,280
Interest Rate
5.04%
Mortgage Type
Purchase Money Mortgage
Estimated Equity
$1,058,018
Purchase Details
Closed on
May 29, 2007
Sold by
Lee Muriel D
Bought by
Muriel D Lee Ret and Lee Muriel D
Create a Home Valuation Report for This Property
The Home Valuation Report is an in-depth analysis detailing your home's value as well as a comparison with similar homes in the area
Home Values in the Area
Average Home Value in this Area
Purchase History
| Date | Buyer | Sale Price | Title Company |
|---|---|---|---|
| Sturdy Mark E | $570,000 | -- | |
| Muriel D Lee Ret | -- | -- |
Source: Public Records
Mortgage History
| Date | Status | Borrower | Loan Amount |
|---|---|---|---|
| Open | Sturdy Mark E | $300,000 |
Source: Public Records
Tax History Compared to Growth
Tax History
| Year | Tax Paid | Tax Assessment Tax Assessment Total Assessment is a certain percentage of the fair market value that is determined by local assessors to be the total taxable value of land and additions on the property. | Land | Improvement |
|---|---|---|---|---|
| 2025 | $5,222 | $1,205,900 | $527,200 | $678,700 |
| 2024 | $5,076 | $1,156,200 | $507,000 | $649,200 |
| 2023 | $4,909 | $1,051,200 | $460,900 | $590,300 |
| 2022 | $4,533 | $809,500 | $373,700 | $435,800 |
| 2021 | $4,613 | $765,000 | $366,300 | $398,700 |
| 2020 | $2,106 | $710,700 | $348,900 | $361,800 |
| 2019 | $4,094 | $663,600 | $342,100 | $321,500 |
| 2018 | $1,972 | $621,500 | $325,600 | $295,900 |
| 2017 | $3,770 | $613,000 | $325,700 | $287,300 |
| 2016 | $3,834 | $587,200 | $341,900 | $245,300 |
| 2015 | $3,758 | $587,200 | $341,900 | $245,300 |
| 2014 | $3,557 | $560,100 | $314,800 | $245,300 |
Source: Public Records
Map
Nearby Homes
- 2 Rita Mary Way
- 181 Pleasant St
- 14 Schoolhouse Ln
- 308 Old Main St
- 209 Main St Unit 3
- 209 Main St Unit 6
- 209 Main St Unit 1
- 209 Main St Unit 2
- 209 Main St Unit 4
- 209 Main St Unit 5
- 45 Seth Ln
- 178 School St
- 40 Kelley Rd
- 23 Doric Ave
- 22 Powhatan Rd
- 745 Willow St
- 29 Bass River Rd
- 401 Main St Unit 201
- 401 Main St Unit 101
- 15 Sharon Rd
- 32 Davenport Rd
- 22 Davenport Rd
- 31 Old Field Rd
- 27 Davenport Rd
- 25 Old Field Rd
- 23 Davenport Rd
- 33 Davenport Rd
- 38 Davenport Rd
- 18 Davenport Rd
- 17 Davenport Rd
- 28 Garfield Ln
- 37 Old Field Rd
- 22 Garfield Ln
- 37 Davenport Rd
- 32 Garfield Ln
- 19 Old Field Rd
- 42 Davenport Rd
- 18 Garfield Ln
- 12 Davenport Rd
- 11 Davenport Rd