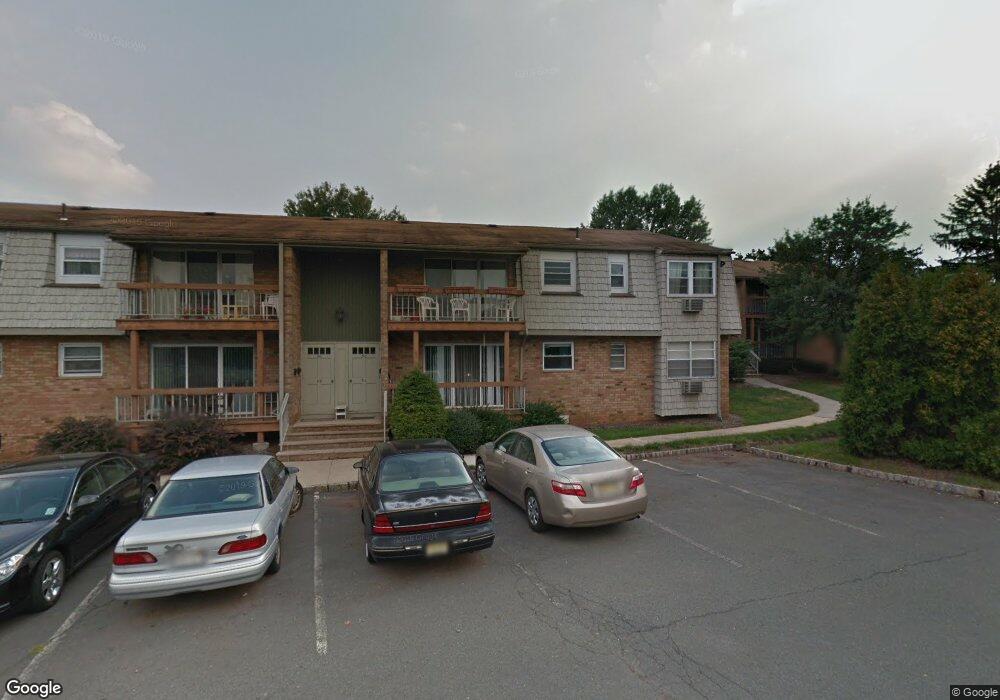
28 Deanna Dr Unit 64 Hillsborough, NJ 08844
Estimated Value: $250,000 - $258,196
1
Bed
1
Bath
873
Sq Ft
$292/Sq Ft
Est. Value
About This Home
This home is located at 28 Deanna Dr Unit 64, Hillsborough, NJ 08844 and is currently estimated at $255,049, approximately $292 per square foot. 28 Deanna Dr Unit 64 is a home located in Somerset County with nearby schools including Hillsborough High School and Brighthorizons at Hillsborough.
Ownership History
Date
Name
Owned For
Owner Type
Purchase Details
Closed on
Feb 2, 2018
Sold by
Eichler William
Bought by
Matthews Theodore L
Current Estimated Value
Home Financials for this Owner
Home Financials are based on the most recent Mortgage that was taken out on this home.
Original Mortgage
$126,900
Outstanding Balance
$107,473
Interest Rate
3.99%
Mortgage Type
New Conventional
Estimated Equity
$147,576
Purchase Details
Closed on
Oct 15, 2003
Sold by
Wielgus Janina Wiszniewska
Bought by
Calise Gerald and Zadigian Stacy
Home Financials for this Owner
Home Financials are based on the most recent Mortgage that was taken out on this home.
Original Mortgage
$111,600
Interest Rate
6.15%
Purchase Details
Closed on
Sep 14, 1999
Sold by
Simsbury Asso
Bought by
Wielgus Janina Wiszniewska
Home Financials for this Owner
Home Financials are based on the most recent Mortgage that was taken out on this home.
Original Mortgage
$44,500
Interest Rate
7.83%
Create a Home Valuation Report for This Property
The Home Valuation Report is an in-depth analysis detailing your home's value as well as a comparison with similar homes in the area
Home Values in the Area
Average Home Value in this Area
Purchase History
| Date | Buyer | Sale Price | Title Company |
|---|---|---|---|
| Matthews Theodore L | $141,000 | First Legacy Group Title & A | |
| Calise Gerald | $124,000 | -- | |
| Wielgus Janina Wiszniewska | $56,500 | -- |
Source: Public Records
Mortgage History
| Date | Status | Borrower | Loan Amount |
|---|---|---|---|
| Open | Matthews Theodore L | $126,900 | |
| Previous Owner | Calise Gerald | $111,600 | |
| Previous Owner | Wielgus Janina Wiszniewska | $44,500 |
Source: Public Records
Tax History Compared to Growth
Tax History
| Year | Tax Paid | Tax Assessment Tax Assessment Total Assessment is a certain percentage of the fair market value that is determined by local assessors to be the total taxable value of land and additions on the property. | Land | Improvement |
|---|---|---|---|---|
| 2025 | $3,782 | $203,200 | $105,000 | $98,200 |
| 2024 | $3,782 | $176,500 | $95,000 | $81,500 |
| 2023 | $3,477 | $161,500 | $80,000 | $81,500 |
| 2022 | $3,055 | $136,800 | $60,000 | $76,800 |
| 2021 | $2,902 | $123,600 | $45,000 | $78,600 |
| 2020 | $2,956 | $124,000 | $45,000 | $79,000 |
| 2019 | $3,096 | $128,800 | $45,000 | $83,800 |
| 2018 | $2,862 | $118,300 | $45,000 | $73,300 |
| 2017 | $2,657 | $110,000 | $40,000 | $70,000 |
| 2016 | $2,665 | $110,400 | $40,000 | $70,400 |
| 2015 | $2,742 | $115,000 | $40,000 | $75,000 |
| 2014 | $2,787 | $119,400 | $40,000 | $79,400 |
Source: Public Records
Map
Nearby Homes
- 18 Deanna Dr Unit 37
- 524 Andria Ave Unit 225
- 528 Andria Ave Unit 253
- 528 Andria Ave Unit 255
- 180 Wildflower Ln
- 6 Crestwood Ave
- 12 Cranbrook Ave
- 213 Brookside Ln
- 3203 Astor Close
- 3301 Astor Close
- 23 Cranbrook Ave
- 2301 Trafalgar Square
- 614 Robin Rd
- 17 Old Somerville Rd
- 351 Doctors Way
- 920 Robin Rd
- 812-822 U S Highway 206
- 3 Tunison Close
- 51 Taurus Dr Unit 3A
- 903A Marlborough Common
- 28 Deanna Dr Unit 60
- 28 Deanna Dr Unit 52
- 28 Deanna Dr Unit 57
- 28 Deanna Dr Unit 59
- 28 Deanna Dr Unit 63
- 28 Deanna Dr Unit 58
- 28 Deanna Dr Unit 50
- 28 Deanna Dr Unit 62
- 28 Deanna Dr Unit 54
- 28 Deanna Dr Unit 56
- 28 Deanna Dr Unit 53
- 28 Deanna Dr Unit 49
- 28 Deanna Dr Unit 61
- 28 Deanna Dr
- 32 Deanna Dr
- 32 Deanna Dr Unit 66
- 32 Deanna Dr Unit 73
- 32 Deanna Dr Unit 72
- 32 Deanna Dr Unit 68
- 32 Deanna Dr Unit 71