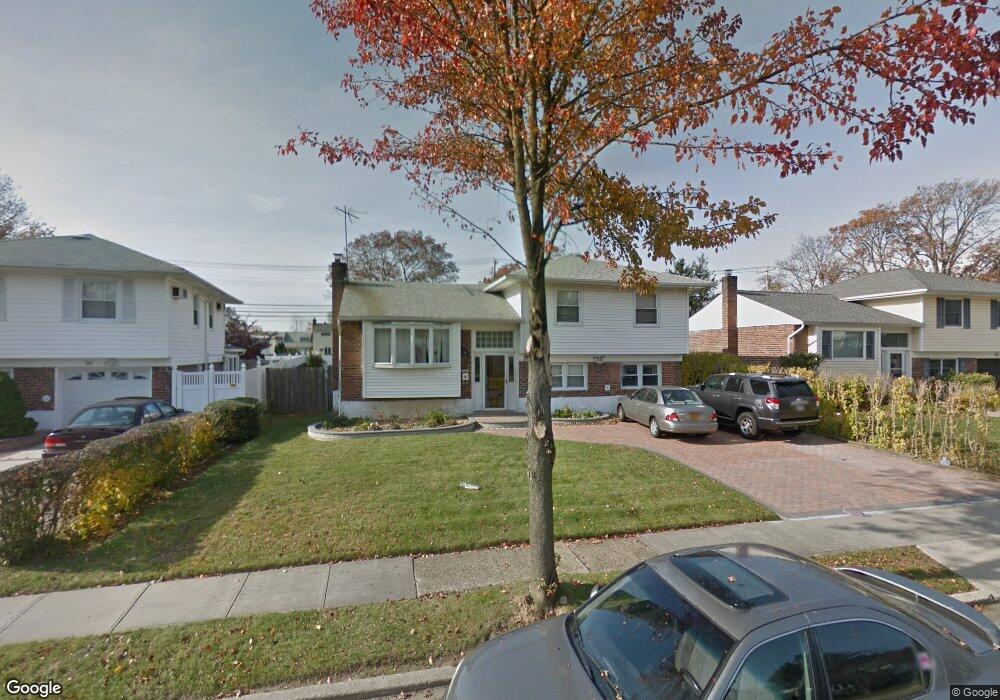
28 Denise St Massapequa, NY 11758
Estimated Value: $606,519 - $618,000
--
Bed
2
Baths
1,166
Sq Ft
$525/Sq Ft
Est. Value
About This Home
This home is located at 28 Denise St, Massapequa, NY 11758 and is currently estimated at $612,260, approximately $525 per square foot. 28 Denise St is a home located in Nassau County with nearby schools including Northeast Elementary School, Northwest Elementary School, and Park Avenue Memorial Elementary School.
Ownership History
Date
Name
Owned For
Owner Type
Purchase Details
Closed on
Mar 15, 2012
Sold by
Newman Keith and Newman Dorothy H
Bought by
Pierre-Louis Joanne
Current Estimated Value
Purchase Details
Closed on
Jul 31, 1995
Sold by
Bedell Marilyn Est
Bought by
Louis Riviere
Home Financials for this Owner
Home Financials are based on the most recent Mortgage that was taken out on this home.
Original Mortgage
$60,000
Interest Rate
7.48%
Create a Home Valuation Report for This Property
The Home Valuation Report is an in-depth analysis detailing your home's value as well as a comparison with similar homes in the area
Home Values in the Area
Average Home Value in this Area
Purchase History
| Date | Buyer | Sale Price | Title Company |
|---|---|---|---|
| Pierre-Louis Joanne | $200,000 | Not Available | |
| Louis Riviere | $100,000 | -- |
Source: Public Records
Mortgage History
| Date | Status | Borrower | Loan Amount |
|---|---|---|---|
| Previous Owner | Louis Riviere | $60,000 |
Source: Public Records
Tax History Compared to Growth
Tax History
| Year | Tax Paid | Tax Assessment Tax Assessment Total Assessment is a certain percentage of the fair market value that is determined by local assessors to be the total taxable value of land and additions on the property. | Land | Improvement |
|---|---|---|---|---|
| 2025 | $10,938 | $380 | $152 | $228 |
| 2024 | $3,531 | $422 | $169 | $253 |
| 2023 | $10,243 | $403 | $161 | $242 |
| 2022 | $10,243 | $438 | $175 | $263 |
| 2021 | $11,966 | $425 | $163 | $262 |
| 2020 | $11,233 | $714 | $460 | $254 |
| 2019 | $12,713 | $714 | $460 | $254 |
| 2018 | $12,152 | $714 | $0 | $0 |
| 2017 | $6,685 | $714 | $460 | $254 |
| 2016 | $10,063 | $714 | $460 | $254 |
| 2015 | $3,027 | $714 | $460 | $254 |
| 2014 | $3,027 | $714 | $460 | $254 |
| 2013 | $2,747 | $714 | $460 | $254 |
Source: Public Records
Map
Nearby Homes