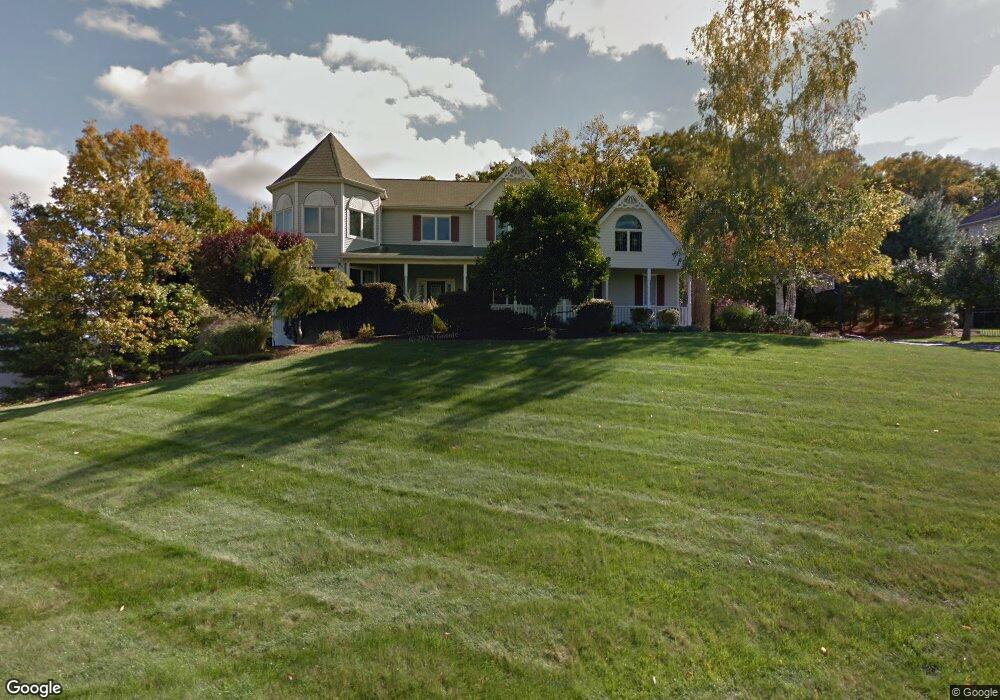
28 Dickens St Stony Point, NY 10980
Estimated Value: $993,000 - $1,077,000
4
Beds
3
Baths
3,037
Sq Ft
$338/Sq Ft
Est. Value
About This Home
This home is located at 28 Dickens St, Stony Point, NY 10980 and is currently estimated at $1,028,010, approximately $338 per square foot. 28 Dickens St is a home located in Rockland County with nearby schools including James A. Farley Middle School, Stony Point Elementary School, and Fieldstone Secondary School.
Ownership History
Date
Name
Owned For
Owner Type
Purchase Details
Closed on
Aug 14, 1998
Sold by
Dore Eneo P and Dore Maria
Bought by
Kern Timothy E and Kern Amy E
Current Estimated Value
Purchase Details
Closed on
Dec 14, 1995
Sold by
Cedarcrest Construction Corp
Bought by
Dore Eneo P and Dore Maria
Home Financials for this Owner
Home Financials are based on the most recent Mortgage that was taken out on this home.
Original Mortgage
$203,150
Interest Rate
7.33%
Mortgage Type
Construction
Create a Home Valuation Report for This Property
The Home Valuation Report is an in-depth analysis detailing your home's value as well as a comparison with similar homes in the area
Home Values in the Area
Average Home Value in this Area
Purchase History
| Date | Buyer | Sale Price | Title Company |
|---|---|---|---|
| Kern Timothy E | $425,000 | Trw Title Insurance Of Ny In | |
| Dore Eneo P | $346,120 | -- |
Source: Public Records
Mortgage History
| Date | Status | Borrower | Loan Amount |
|---|---|---|---|
| Previous Owner | Dore Eneo P | $203,150 |
Source: Public Records
Tax History Compared to Growth
Tax History
| Year | Tax Paid | Tax Assessment Tax Assessment Total Assessment is a certain percentage of the fair market value that is determined by local assessors to be the total taxable value of land and additions on the property. | Land | Improvement |
|---|---|---|---|---|
| 2024 | $25,748 | $75,000 | $12,500 | $62,500 |
| 2023 | $25,748 | $75,000 | $12,500 | $62,500 |
| 2022 | $6,891 | $75,000 | $12,500 | $62,500 |
| 2021 | $6,891 | $75,000 | $12,500 | $62,500 |
| 2020 | $20,366 | $75,000 | $12,500 | $62,500 |
| 2019 | $5,373 | $75,000 | $12,500 | $62,500 |
| 2018 | $20,056 | $75,000 | $12,500 | $62,500 |
| 2017 | $19,899 | $75,000 | $12,500 | $62,500 |
| 2016 | $20,405 | $75,000 | $12,500 | $62,500 |
| 2015 | -- | $75,000 | $12,500 | $62,500 |
| 2014 | -- | $75,000 | $12,500 | $62,500 |
Source: Public Records
Map
Nearby Homes