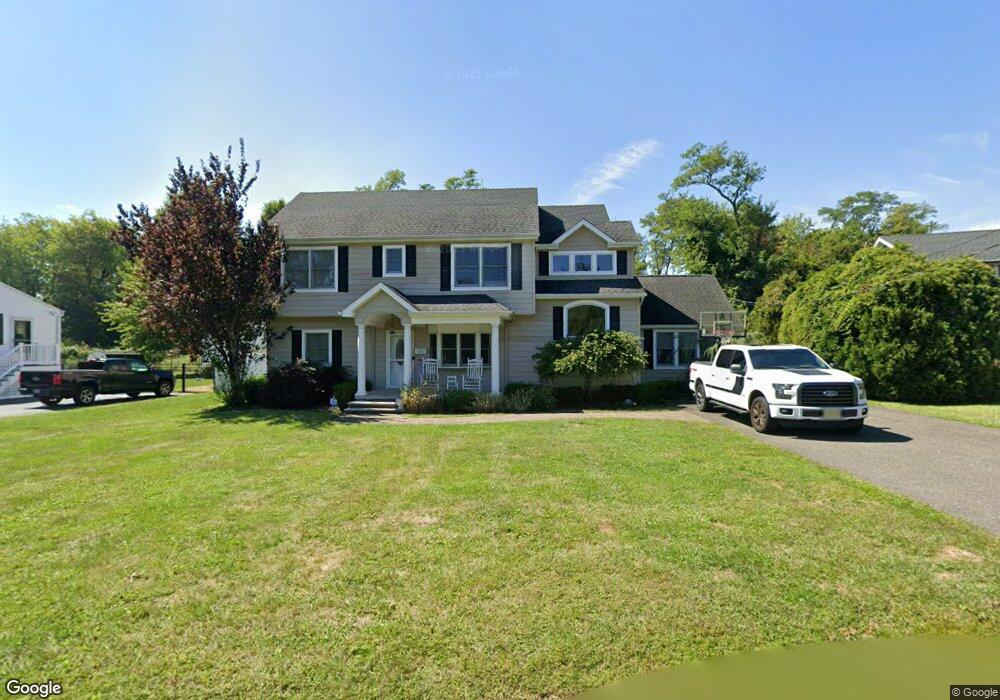
28 Doreen Dr Oceanport, NJ 07757
Estimated Value: $927,000 - $1,146,000
3
Beds
2
Baths
2,826
Sq Ft
$361/Sq Ft
Est. Value
About This Home
This home is located at 28 Doreen Dr, Oceanport, NJ 07757 and is currently estimated at $1,019,334, approximately $360 per square foot. 28 Doreen Dr is a home located in Monmouth County with nearby schools including Wolf Hill Elementary School, Maple Place Elementary and Middle School, and Shore Regional High School.
Ownership History
Date
Name
Owned For
Owner Type
Purchase Details
Closed on
Apr 30, 2018
Sold by
Vanvanbrunt Paul Van and Brunt Francine Van
Bought by
Vanvanbrunt Paul Van
Current Estimated Value
Home Financials for this Owner
Home Financials are based on the most recent Mortgage that was taken out on this home.
Original Mortgage
$453,000
Outstanding Balance
$390,407
Interest Rate
4.44%
Mortgage Type
New Conventional
Estimated Equity
$628,927
Purchase Details
Closed on
Jun 18, 2010
Sold by
Vanbrunt Frank H and Van Brunt Lydia
Bought by
Vanbrunt Paul and Van Brunt Francine
Purchase Details
Closed on
Oct 21, 2009
Sold by
Vanbrunt Frank H and Johnson Barbara M
Bought by
Vanbrunt Paul and Van Brunt Francine
Purchase Details
Closed on
Jul 5, 2006
Sold by
Vanbrunt Frank H
Bought by
Vanbrunt Frank H and Johnson Barbara M
Create a Home Valuation Report for This Property
The Home Valuation Report is an in-depth analysis detailing your home's value as well as a comparison with similar homes in the area
Home Values in the Area
Average Home Value in this Area
Purchase History
| Date | Buyer | Sale Price | Title Company |
|---|---|---|---|
| Vanvanbrunt Paul Van | -- | Westcor Land Title Ins Co | |
| Vanbrunt Paul | -- | Trident Abstract Title Agenc | |
| Vanbrunt Paul | -- | None Available | |
| Vanbrunt Frank H | -- | -- |
Source: Public Records
Mortgage History
| Date | Status | Borrower | Loan Amount |
|---|---|---|---|
| Open | Vanvanbrunt Paul Van | $453,000 |
Source: Public Records
Tax History Compared to Growth
Tax History
| Year | Tax Paid | Tax Assessment Tax Assessment Total Assessment is a certain percentage of the fair market value that is determined by local assessors to be the total taxable value of land and additions on the property. | Land | Improvement |
|---|---|---|---|---|
| 2025 | $12,417 | $816,000 | $367,000 | $449,000 |
| 2024 | $12,646 | $786,400 | $357,000 | $429,400 |
| 2023 | $12,646 | $760,000 | $352,000 | $408,000 |
| 2022 | $12,832 | $701,200 | $342,000 | $359,200 |
| 2021 | $12,832 | $673,600 | $332,000 | $341,600 |
| 2020 | $12,297 | $672,700 | $337,000 | $335,700 |
| 2019 | $11,905 | $661,000 | $337,000 | $324,000 |
| 2018 | $11,756 | $657,100 | $337,000 | $320,100 |
| 2017 | $8,563 | $397,000 | $196,000 | $201,000 |
| 2016 | $8,426 | $393,200 | $196,000 | $197,200 |
| 2015 | $7,799 | $388,100 | $196,000 | $192,100 |
| 2014 | $8,267 | $416,500 | $246,000 | $170,500 |
Source: Public Records
Map
Nearby Homes
- 13 Morris Place
- 238 Branchport Ave
- 572 Jay St
- 565 Joline Ave
- 265 Port Au Peck Ave
- 66 Shrewsbury Ave
- 15 Signal Ave
- 631 Irving Place
- 401 Joline Ave
- 190 Spruce St Unit 4
- 10 Asbury Ave
- 119 Washington St
- 11 Clay St
- 3 Foggia Way
- 139 Sixth Ave
- 211 Rockwell Ave
- 151 N 5th Ave
- 395 Broadway
- 8 Pocahontas Ave
- 430 Broadway