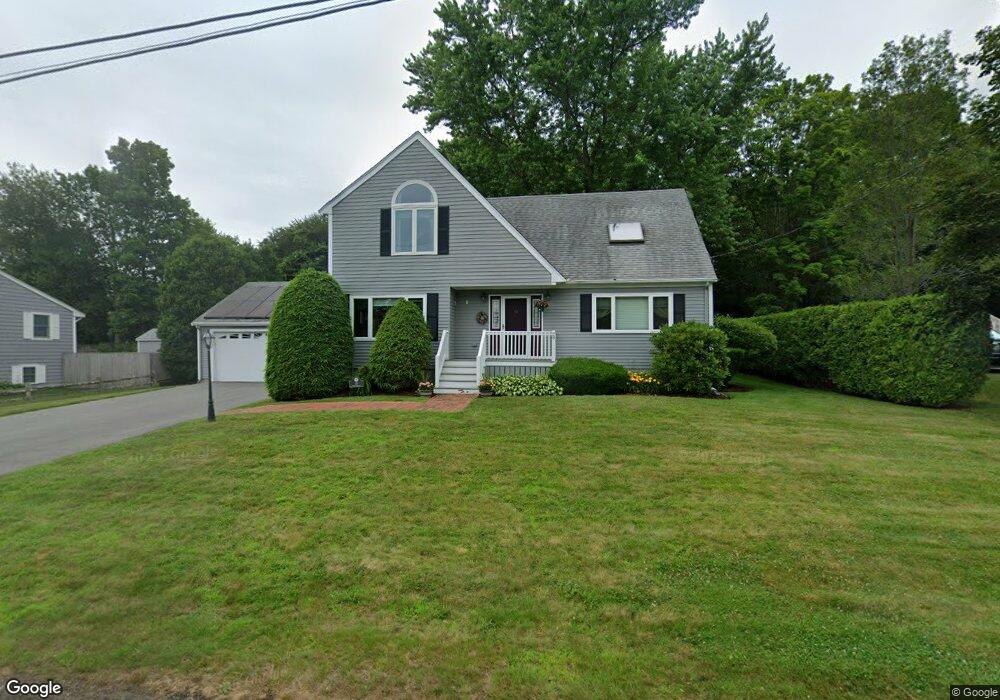
28 Dorothy Rd Whitman, MA 02382
Estimated Value: $597,511 - $703,000
4
Beds
2
Baths
1,927
Sq Ft
$343/Sq Ft
Est. Value
About This Home
This home is located at 28 Dorothy Rd, Whitman, MA 02382 and is currently estimated at $660,128, approximately $342 per square foot. 28 Dorothy Rd is a home located in Plymouth County with nearby schools including St Bridget School.
Ownership History
Date
Name
Owned For
Owner Type
Purchase Details
Closed on
Feb 27, 2021
Sold by
Bedard Timothy J
Bought by
Bedard Ft and Cordaro
Current Estimated Value
Purchase Details
Closed on
Sep 3, 2019
Sold by
Potter Stacey and Potter Erik S
Bought by
Potter Stephen R and Potter Paula T
Purchase Details
Closed on
Aug 29, 2019
Sold by
Potter Ft
Bought by
Potter Stacey A and Potter Erik S
Purchase Details
Closed on
Apr 8, 2019
Sold by
Potter Stephen R and Potter Paula T
Bought by
Potter Ft and Potter
Purchase Details
Closed on
Oct 7, 2005
Sold by
Hanley Martin T and Hanley Dale M
Bought by
Potter Paula T and Potter Stephen R
Create a Home Valuation Report for This Property
The Home Valuation Report is an in-depth analysis detailing your home's value as well as a comparison with similar homes in the area
Home Values in the Area
Average Home Value in this Area
Purchase History
| Date | Buyer | Sale Price | Title Company |
|---|---|---|---|
| Bedard Ft | -- | None Available | |
| Potter Stephen R | -- | -- | |
| Potter Stacey A | -- | -- | |
| Potter Ft | -- | -- | |
| Potter Paula T | $419,000 | -- | |
| Potter Paula T | $419,000 | -- |
Source: Public Records
Mortgage History
| Date | Status | Borrower | Loan Amount |
|---|---|---|---|
| Previous Owner | Potter Paula T | $90,000 | |
| Previous Owner | Potter Paula T | $105,000 | |
| Previous Owner | Potter Paula T | $81,000 |
Source: Public Records
Tax History Compared to Growth
Tax History
| Year | Tax Paid | Tax Assessment Tax Assessment Total Assessment is a certain percentage of the fair market value that is determined by local assessors to be the total taxable value of land and additions on the property. | Land | Improvement |
|---|---|---|---|---|
| 2025 | $6,652 | $507,000 | $217,400 | $289,600 |
| 2024 | $6,102 | $479,000 | $213,200 | $265,800 |
| 2023 | $5,823 | $429,100 | $184,800 | $244,300 |
| 2022 | $5,751 | $395,000 | $168,000 | $227,000 |
| 2021 | $5,721 | $369,100 | $162,800 | $206,300 |
| 2020 | $5,605 | $353,600 | $154,400 | $199,200 |
| 2019 | $5,223 | $339,600 | $154,400 | $185,200 |
| 2018 | $4,883 | $318,400 | $147,000 | $171,400 |
| 2017 | $4,801 | $318,400 | $147,000 | $171,400 |
| 2016 | $4,484 | $287,600 | $131,300 | $156,300 |
| 2015 | $4,405 | $282,200 | $131,300 | $150,900 |
Source: Public Records
Map
Nearby Homes
- 63 Dewey Ave
- 1098 Bedford St
- 164 Warren Ave
- 87 Summer St
- 135-137 Temple St
- 300 High St
- 53 Temple St
- 110 South Ave Unit 14
- 110 South Ave
- 66 Belmont St
- 360 High St
- 608 Plymouth St
- 532 Washington St
- 48 Day St
- 40 Bedford St
- 20 Elm Place
- 604 Bedford St Unit 5
- 170 Pleasant St
- 54-56 Stetson St
- 21 Strawberry Ln