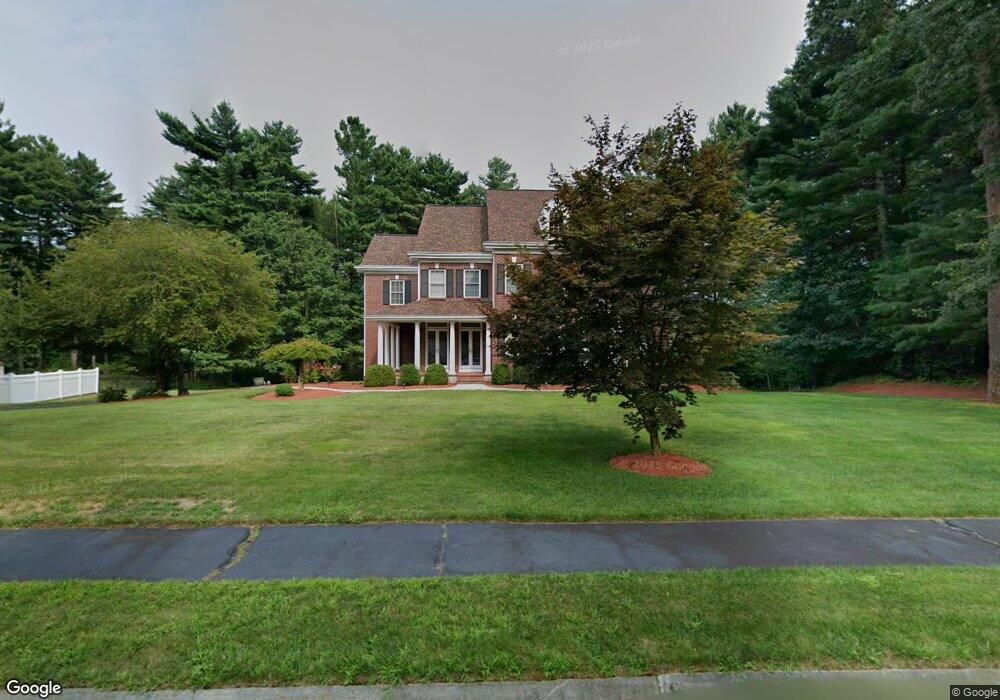
28 Douglas Dr Mansfield, MA 02048
Estimated Value: $1,050,000 - $1,105,000
4
Beds
5
Baths
4,020
Sq Ft
$267/Sq Ft
Est. Value
About This Home
This home is located at 28 Douglas Dr, Mansfield, MA 02048 and is currently estimated at $1,074,162, approximately $267 per square foot. 28 Douglas Dr is a home located in Bristol County with nearby schools including Everett W. Robinson Elementary School, Jordan/Jackson Elementary School, and Harold L. Qualters Middle School.
Ownership History
Date
Name
Owned For
Owner Type
Purchase Details
Closed on
Mar 28, 1997
Sold by
Mccafferty Brian F and Mccafferty Debra A
Bought by
Whyte Richard G
Current Estimated Value
Purchase Details
Closed on
Jan 29, 1996
Sold by
Baker Dennis H and Baker Kelli L
Bought by
Mccafferty Brian F and Mccafferty Debra A
Create a Home Valuation Report for This Property
The Home Valuation Report is an in-depth analysis detailing your home's value as well as a comparison with similar homes in the area
Home Values in the Area
Average Home Value in this Area
Purchase History
| Date | Buyer | Sale Price | Title Company |
|---|---|---|---|
| Whyte Richard G | $122,500 | -- | |
| Mccafferty Brian F | $120,000 | -- |
Source: Public Records
Mortgage History
| Date | Status | Borrower | Loan Amount |
|---|---|---|---|
| Open | Mccafferty Brian F | $345,000 | |
| Closed | Mccafferty Brian F | $128,300 | |
| Closed | Mccafferty Brian F | $205,000 |
Source: Public Records
Tax History Compared to Growth
Tax History
| Year | Tax Paid | Tax Assessment Tax Assessment Total Assessment is a certain percentage of the fair market value that is determined by local assessors to be the total taxable value of land and additions on the property. | Land | Improvement |
|---|---|---|---|---|
| 2025 | $12,936 | $982,200 | $279,800 | $702,400 |
| 2024 | $12,828 | $950,200 | $292,400 | $657,800 |
| 2023 | $12,215 | $866,900 | $292,400 | $574,500 |
| 2022 | $11,675 | $769,600 | $270,900 | $498,700 |
| 2021 | $4,858 | $782,700 | $255,100 | $527,600 |
| 2020 | $11,809 | $768,800 | $255,100 | $513,700 |
| 2019 | $11,671 | $766,800 | $237,000 | $529,800 |
| 2018 | $4,351 | $746,600 | $226,300 | $520,300 |
| 2017 | $10,906 | $726,100 | $220,000 | $506,100 |
| 2016 | $10,927 | $709,100 | $240,900 | $468,200 |
| 2015 | $10,624 | $685,400 | $240,900 | $444,500 |
Source: Public Records
Map
Nearby Homes