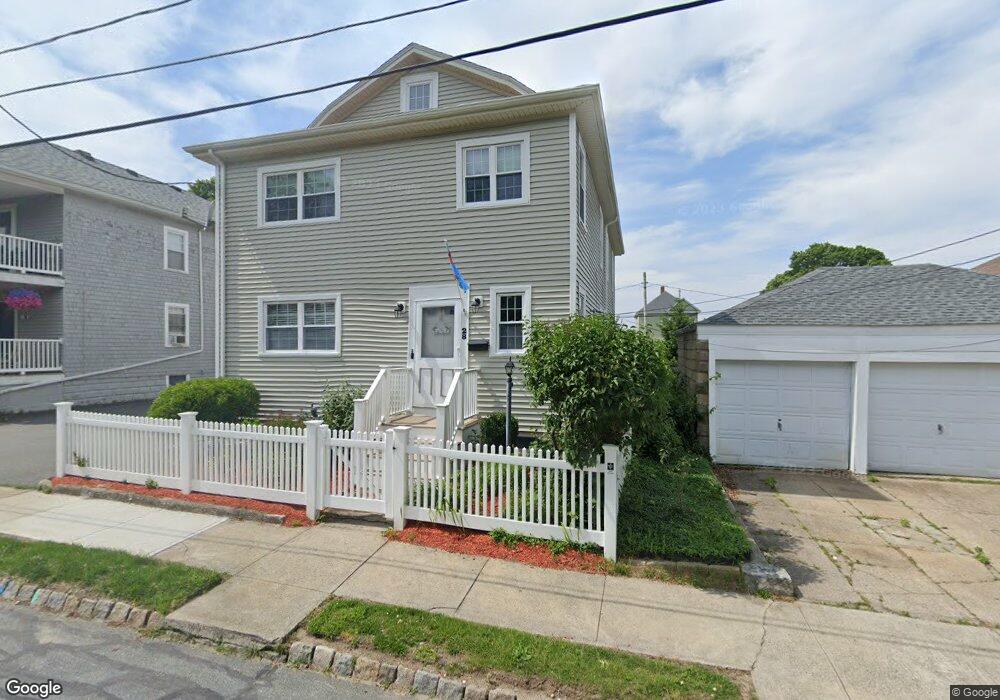
28 Dover St Fairhaven, MA 02719
North Fairhaven NeighborhoodEstimated Value: $474,000 - $568,000
5
Beds
2
Baths
2,224
Sq Ft
$232/Sq Ft
Est. Value
About This Home
This home is located at 28 Dover St, Fairhaven, MA 02719 and is currently estimated at $516,942, approximately $232 per square foot. 28 Dover St is a home located in Bristol County with nearby schools including Fairhaven High School, Alma Del Mar Charter School, and St. Joseph School.
Ownership History
Date
Name
Owned For
Owner Type
Purchase Details
Closed on
Apr 18, 2013
Sold by
Dorgan Karen
Bought by
Dorgan Karen and Simoes Hillary E
Current Estimated Value
Purchase Details
Closed on
Aug 12, 1996
Sold by
Hanczaryk Theresa M
Bought by
Dorgan Robert F and Dorgan Karen
Home Financials for this Owner
Home Financials are based on the most recent Mortgage that was taken out on this home.
Original Mortgage
$110,000
Interest Rate
8.24%
Mortgage Type
Purchase Money Mortgage
Create a Home Valuation Report for This Property
The Home Valuation Report is an in-depth analysis detailing your home's value as well as a comparison with similar homes in the area
Home Values in the Area
Average Home Value in this Area
Purchase History
| Date | Buyer | Sale Price | Title Company |
|---|---|---|---|
| Dorgan Karen | -- | -- | |
| Dorgan Robert F | $120,000 | -- |
Source: Public Records
Mortgage History
| Date | Status | Borrower | Loan Amount |
|---|---|---|---|
| Previous Owner | Dorgan Robert F | $53,500 | |
| Previous Owner | Dorgan Robert F | $110,000 |
Source: Public Records
Tax History Compared to Growth
Tax History
| Year | Tax Paid | Tax Assessment Tax Assessment Total Assessment is a certain percentage of the fair market value that is determined by local assessors to be the total taxable value of land and additions on the property. | Land | Improvement |
|---|---|---|---|---|
| 2025 | $3,760 | $403,400 | $169,900 | $233,500 |
| 2024 | $3,656 | $396,100 | $169,900 | $226,200 |
| 2023 | $3,552 | $357,000 | $148,800 | $208,200 |
| 2022 | $3,409 | $333,600 | $138,300 | $195,300 |
| 2021 | $3,302 | $292,500 | $125,100 | $167,400 |
| 2020 | $3,235 | $292,500 | $125,100 | $167,400 |
| 2019 | $3,227 | $276,500 | $103,800 | $172,700 |
| 2018 | $3,030 | $257,900 | $98,800 | $159,100 |
| 2017 | $2,872 | $238,500 | $98,800 | $139,700 |
| 2016 | $2,755 | $226,200 | $98,800 | $127,400 |
| 2015 | $2,707 | $222,800 | $98,800 | $124,000 |
Source: Public Records
Map
Nearby Homes