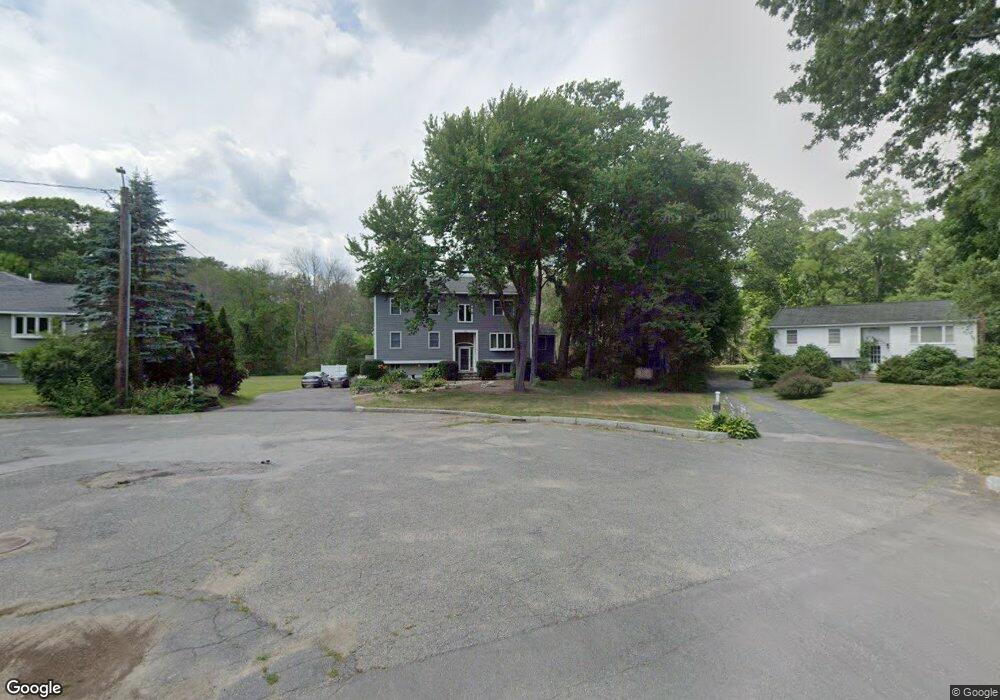
28 Dwight Ave Natick, MA 01760
Estimated Value: $1,269,000 - $1,331,681
4
Beds
4
Baths
2,970
Sq Ft
$439/Sq Ft
Est. Value
About This Home
This home is located at 28 Dwight Ave, Natick, MA 01760 and is currently estimated at $1,302,420, approximately $438 per square foot. 28 Dwight Ave is a home located in Middlesex County with nearby schools including Natick High School, Bennett-Hemenway (Ben-Hem) Elementary School, and Wilson Middle School.
Ownership History
Date
Name
Owned For
Owner Type
Purchase Details
Closed on
Mar 30, 2000
Sold by
Tripp Mark V and Tripp Donna M
Bought by
Poulack James P and Poulack Christine P
Current Estimated Value
Purchase Details
Closed on
Aug 25, 1989
Sold by
Paras John J
Bought by
Tripp Mark V
Home Financials for this Owner
Home Financials are based on the most recent Mortgage that was taken out on this home.
Original Mortgage
$121,500
Interest Rate
9.67%
Mortgage Type
Purchase Money Mortgage
Create a Home Valuation Report for This Property
The Home Valuation Report is an in-depth analysis detailing your home's value as well as a comparison with similar homes in the area
Home Values in the Area
Average Home Value in this Area
Purchase History
| Date | Buyer | Sale Price | Title Company |
|---|---|---|---|
| Poulack James P | $329,900 | -- | |
| Tripp Mark V | $135,000 | -- |
Source: Public Records
Mortgage History
| Date | Status | Borrower | Loan Amount |
|---|---|---|---|
| Open | Tripp Mark V | $50,000 | |
| Previous Owner | Tripp Mark V | $122,000 | |
| Previous Owner | Tripp Mark V | $117,700 | |
| Previous Owner | Tripp Mark V | $121,500 |
Source: Public Records
Tax History
| Year | Tax Paid | Tax Assessment Tax Assessment Total Assessment is a certain percentage of the fair market value that is determined by local assessors to be the total taxable value of land and additions on the property. | Land | Improvement |
|---|---|---|---|---|
| 2025 | $12,612 | $1,054,500 | $476,500 | $578,000 |
| 2024 | $12,108 | $987,600 | $450,100 | $537,500 |
| 2023 | $11,664 | $922,800 | $421,200 | $501,600 |
| 2022 | $11,215 | $840,700 | $382,200 | $458,500 |
| 2021 | $10,767 | $791,100 | $361,200 | $429,900 |
| 2020 | $10,553 | $775,400 | $345,500 | $429,900 |
| 2019 | $9,855 | $775,400 | $345,500 | $429,900 |
| 2018 | $9,033 | $692,200 | $314,100 | $378,100 |
| 2017 | $8,820 | $653,800 | $282,600 | $371,200 |
| 2016 | $8,620 | $635,200 | $267,600 | $367,600 |
| 2015 | $8,304 | $600,900 | $267,600 | $333,300 |
Source: Public Records
Map
Nearby Homes
Your Personal Tour Guide
Ask me questions while you tour the home.