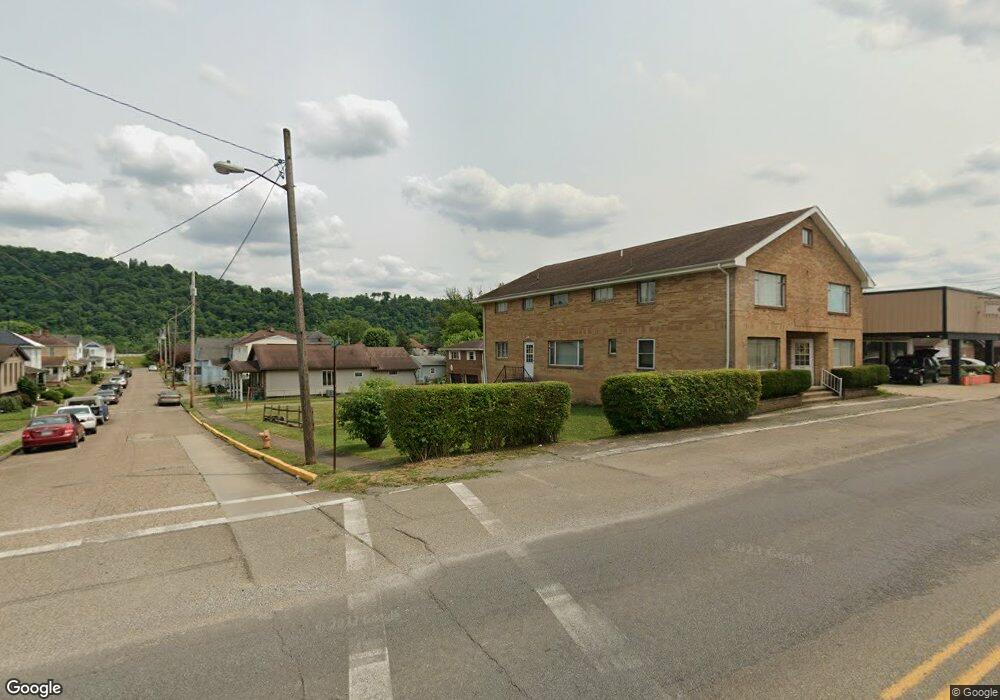
28 E 37th St Shadyside, OH 43947
Estimated Value: $111,000 - $154,000
2
Beds
1
Bath
672
Sq Ft
$187/Sq Ft
Est. Value
About This Home
This home is located at 28 E 37th St, Shadyside, OH 43947 and is currently estimated at $125,806, approximately $187 per square foot. 28 E 37th St is a home located in Belmont County with nearby schools including Jefferson Avenue Elementary School, Leona Avenue Middle School, and Shadyside High School.
Ownership History
Date
Name
Owned For
Owner Type
Purchase Details
Closed on
Jan 1, 1987
Sold by
Delong Douglas M and Delong Vera W
Bought by
Delong Douglas M and Delong Vera W
Current Estimated Value
Create a Home Valuation Report for This Property
The Home Valuation Report is an in-depth analysis detailing your home's value as well as a comparison with similar homes in the area
Home Values in the Area
Average Home Value in this Area
Purchase History
| Date | Buyer | Sale Price | Title Company |
|---|---|---|---|
| Delong Douglas M | -- | -- |
Source: Public Records
Tax History
| Year | Tax Paid | Tax Assessment Tax Assessment Total Assessment is a certain percentage of the fair market value that is determined by local assessors to be the total taxable value of land and additions on the property. | Land | Improvement |
|---|---|---|---|---|
| 2025 | $1,311 | $32,290 | $4,380 | $27,910 |
| 2023 | $1,301 | $29,330 | $4,360 | $24,970 |
| 2022 | $1,300 | $29,336 | $4,364 | $24,972 |
| 2021 | $1,293 | $29,336 | $4,364 | $24,972 |
| 2020 | $1,099 | $24,450 | $3,640 | $20,810 |
| 2019 | $1,102 | $24,450 | $3,640 | $20,810 |
| 2018 | $1,029 | $24,450 | $3,640 | $20,810 |
| 2017 | $996 | $20,160 | $4,200 | $15,960 |
| 2016 | $1,000 | $20,160 | $4,200 | $15,960 |
| 2015 | $1,004 | $20,160 | $4,200 | $15,960 |
| 2014 | $1,067 | $20,980 | $3,820 | $17,160 |
| 2013 | $901 | $20,980 | $3,820 | $17,160 |
Source: Public Records
Map
Nearby Homes
- 52 E 37th St
- 3616 Lincoln Ave
- 3480 Central Ave
- 3892 Highland Ave
- 3970 Central Ave
- 3971 Grandview Ave
- 4011 Central Ave
- 4089 Lincoln Ave
- 249 W 42nd St
- 477 W 39th St
- 271-REAR W 43rd St
- 3927 Daisyview St
- 4422 Lincoln Ave
- 531 W 44th St
- 653 Glen Dale Heights Rd
- 639 Glen Dale Heights Rd
- 0 23rd St
- 27 16th St
- 1334 Locust St
- 0 New Cut Rd
Your Personal Tour Guide
Ask me questions while you tour the home.