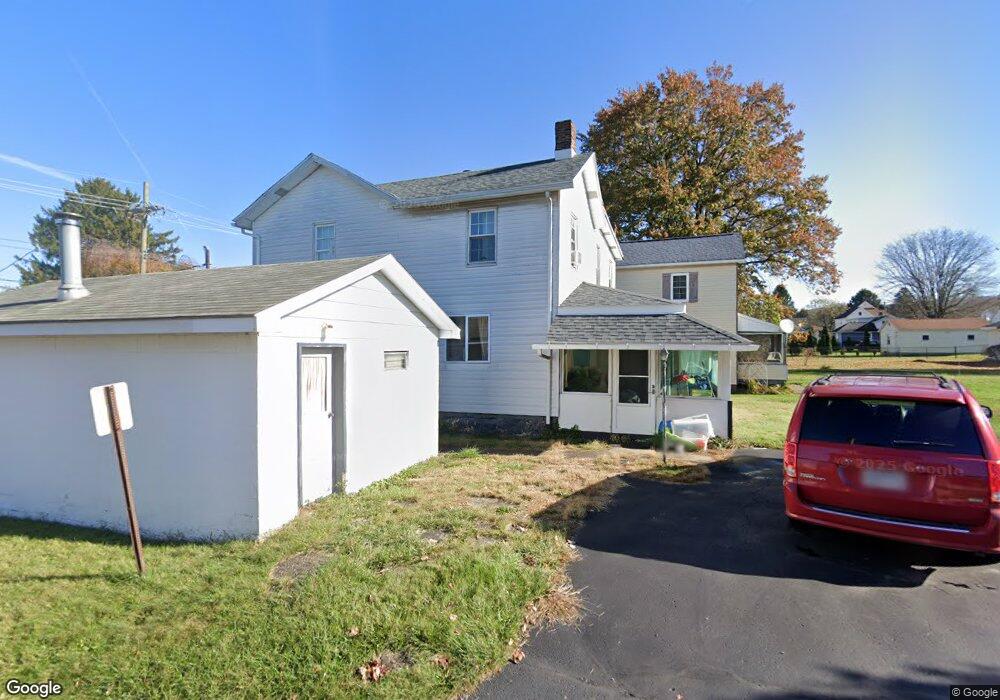
28 E Church St Homer City, PA 15748
Estimated Value: $149,530 - $174,000
3
Beds
2
Baths
1,708
Sq Ft
$93/Sq Ft
Est. Value
About This Home
This home is located at 28 E Church St, Homer City, PA 15748 and is currently estimated at $159,383, approximately $93 per square foot. 28 E Church St is a home with nearby schools including Homer-Center Elementary School and Homer-Center Junior/Senior High School.
Ownership History
Date
Name
Owned For
Owner Type
Purchase Details
Closed on
Jun 27, 2006
Sold by
Deptola Thomas J and Deptola Marcia L
Bought by
Sylvis Leanne N
Current Estimated Value
Home Financials for this Owner
Home Financials are based on the most recent Mortgage that was taken out on this home.
Original Mortgage
$63,200
Outstanding Balance
$4,605
Interest Rate
6.59%
Mortgage Type
New Conventional
Estimated Equity
$154,778
Create a Home Valuation Report for This Property
The Home Valuation Report is an in-depth analysis detailing your home's value as well as a comparison with similar homes in the area
Home Values in the Area
Average Home Value in this Area
Purchase History
| Date | Buyer | Sale Price | Title Company |
|---|---|---|---|
| Sylvis Leanne N | $79,000 | None Available |
Source: Public Records
Mortgage History
| Date | Status | Borrower | Loan Amount |
|---|---|---|---|
| Open | Sylvis Leanne N | $63,200 | |
| Closed | Sylvis Leanne N | $11,850 |
Source: Public Records
Tax History Compared to Growth
Tax History
| Year | Tax Paid | Tax Assessment Tax Assessment Total Assessment is a certain percentage of the fair market value that is determined by local assessors to be the total taxable value of land and additions on the property. | Land | Improvement |
|---|---|---|---|---|
| 2025 | $2,934 | $104,300 | $17,000 | $87,300 |
| 2024 | $2,892 | $104,300 | $17,000 | $87,300 |
| 2023 | $2,739 | $104,300 | $17,000 | $87,300 |
| 2022 | $2,616 | $104,300 | $17,000 | $87,300 |
| 2021 | $2,616 | $104,300 | $17,000 | $87,300 |
| 2020 | $2,568 | $104,300 | $17,000 | $87,300 |
| 2018 | $2,555 | $104,300 | $17,000 | $87,300 |
| 2017 | $2,566 | $104,300 | $17,000 | $87,300 |
| 2016 | -- | $104,300 | $17,000 | $87,300 |
| 2015 | -- | $11,100 | $1,920 | $9,180 |
| 2014 | -- | $11,100 | $1,920 | $9,180 |
Source: Public Records
Map
Nearby Homes