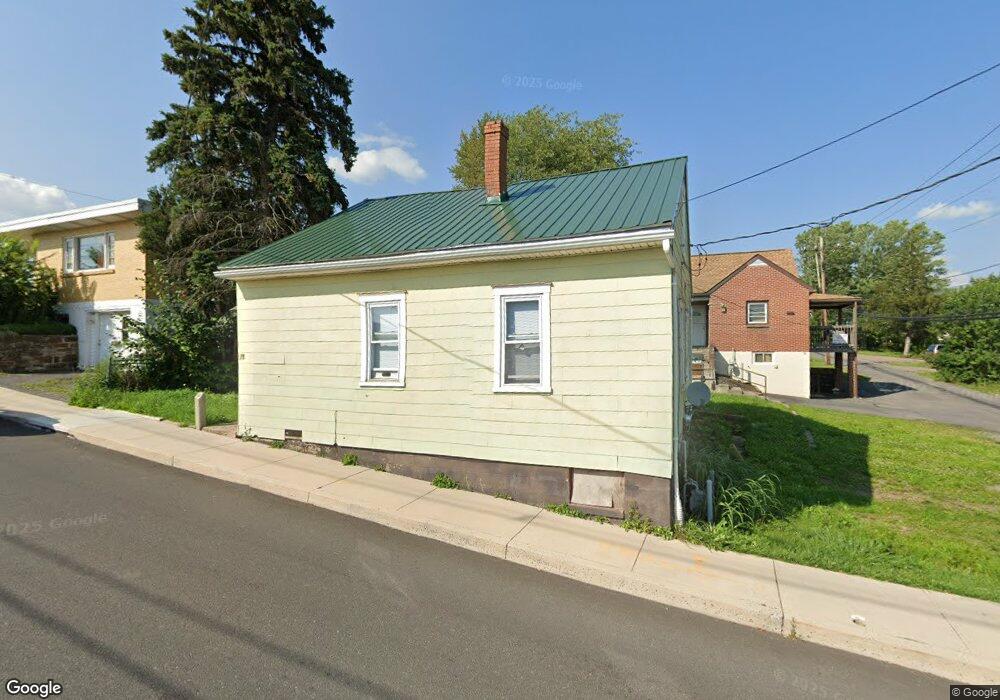
28 E College Ave Unit 28/30 Frostburg, MD 21532
Estimated Value: $85,000 - $116,000
4
Beds
3
Baths
2,290
Sq Ft
$45/Sq Ft
Est. Value
About This Home
This home is located at 28 E College Ave Unit 28/30, Frostburg, MD 21532 and is currently estimated at $103,278, approximately $45 per square foot. 28 E College Ave Unit 28/30 is a home located in Allegany County with nearby schools including Beall Elementary School, Mount Savage Middle School, and Mountain Ridge High School.
Ownership History
Date
Name
Owned For
Owner Type
Purchase Details
Closed on
May 2, 2025
Sold by
Bb & Bz Properties Llc
Bought by
Kimbri Llc
Current Estimated Value
Purchase Details
Closed on
May 5, 2021
Sold by
Kang Junney Richard
Bought by
Bb & Bz Properties Llc
Purchase Details
Closed on
Nov 8, 2019
Sold by
Cesnick Investments Llc
Bought by
Kang Junney Richard
Home Financials for this Owner
Home Financials are based on the most recent Mortgage that was taken out on this home.
Original Mortgage
$35,000
Interest Rate
3.65%
Mortgage Type
Purchase Money Mortgage
Purchase Details
Closed on
Nov 7, 2011
Sold by
Holstead Robert and Holstead Vicki
Bought by
Cesnick Investments Llc
Purchase Details
Closed on
May 29, 2003
Sold by
Good Deal Properties
Bought by
Holstead Robert and Holstead Vicki
Create a Home Valuation Report for This Property
The Home Valuation Report is an in-depth analysis detailing your home's value as well as a comparison with similar homes in the area
Home Values in the Area
Average Home Value in this Area
Purchase History
| Date | Buyer | Sale Price | Title Company |
|---|---|---|---|
| Kimbri Llc | $110,000 | None Listed On Document | |
| Kimbri Llc | $110,000 | None Listed On Document | |
| Bb & Bz Properties Llc | $60,000 | None Available | |
| Kang Junney Richard | $75,000 | None Available | |
| Cesnick Investments Llc | $80,000 | None Available | |
| Holstead Robert | $49,000 | -- |
Source: Public Records
Mortgage History
| Date | Status | Borrower | Loan Amount |
|---|---|---|---|
| Previous Owner | Kang Junney Richard | $35,000 |
Source: Public Records
Tax History Compared to Growth
Tax History
| Year | Tax Paid | Tax Assessment Tax Assessment Total Assessment is a certain percentage of the fair market value that is determined by local assessors to be the total taxable value of land and additions on the property. | Land | Improvement |
|---|---|---|---|---|
| 2025 | $593 | $58,300 | $12,000 | $46,300 |
| 2024 | $602 | $58,300 | $12,000 | $46,300 |
| 2023 | $589 | $58,300 | $12,000 | $46,300 |
| 2022 | $691 | $68,300 | $12,000 | $56,300 |
| 2021 | $664 | $65,267 | $0 | $0 |
| 2020 | $611 | $62,233 | $0 | $0 |
| 2019 | $586 | $59,200 | $12,000 | $47,200 |
| 2018 | $556 | $55,900 | $0 | $0 |
| 2017 | $475 | $52,600 | $0 | $0 |
| 2016 | $480 | $49,300 | $0 | $0 |
| 2015 | $483 | $49,300 | $0 | $0 |
| 2014 | $483 | $49,300 | $0 | $0 |
Source: Public Records
Map
Nearby Homes