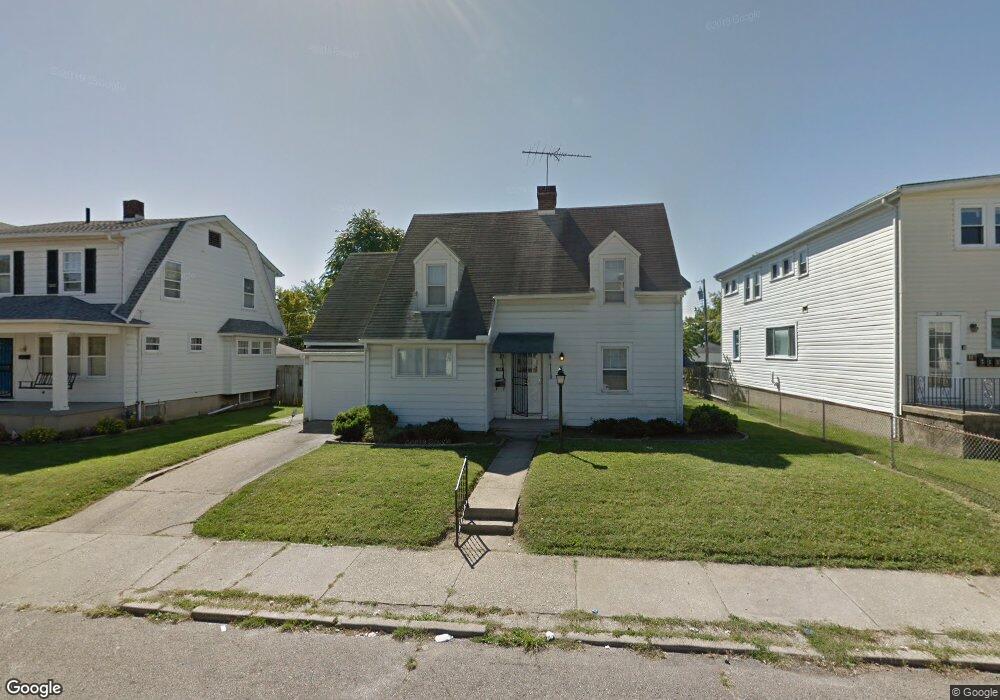
28 E Maplewood Ave Dayton, OH 45405
North Riverdale NeighborhoodEstimated Value: $79,000 - $120,000
3
Beds
2
Baths
1,008
Sq Ft
$99/Sq Ft
Est. Value
About This Home
This home is located at 28 E Maplewood Ave, Dayton, OH 45405 and is currently estimated at $99,780, approximately $98 per square foot. 28 E Maplewood Ave is a home located in Montgomery County with nearby schools including Valerie Elementary School, Deca Prep, and Horizon Science Academy-Dayton Elementary School.
Ownership History
Date
Name
Owned For
Owner Type
Purchase Details
Closed on
Dec 27, 2017
Sold by
Octagon Holdings Llc
Bought by
Main Homes Llc
Current Estimated Value
Home Financials for this Owner
Home Financials are based on the most recent Mortgage that was taken out on this home.
Original Mortgage
$2,550,000
Outstanding Balance
$2,132,286
Interest Rate
3.95%
Mortgage Type
Commercial
Estimated Equity
-$2,032,506
Purchase Details
Closed on
Dec 8, 2014
Sold by
Secretary Of Hud
Bought by
Octagon Holdings Llc
Purchase Details
Closed on
Sep 26, 2012
Sold by
Saalman Tara T
Bought by
Liberty Savings Bank Fsb
Purchase Details
Closed on
Aug 16, 2012
Sold by
Liberty Savings Bank Fsb
Bought by
Secretary Of Hud
Purchase Details
Closed on
Apr 24, 2009
Sold by
Weber Fred and Weber Judith C
Bought by
Saalman Tara T
Home Financials for this Owner
Home Financials are based on the most recent Mortgage that was taken out on this home.
Original Mortgage
$63,822
Interest Rate
4.85%
Mortgage Type
FHA
Purchase Details
Closed on
Oct 15, 2001
Sold by
Fies Robert L and Fies Marilyn M
Bought by
Weber Fred
Create a Home Valuation Report for This Property
The Home Valuation Report is an in-depth analysis detailing your home's value as well as a comparison with similar homes in the area
Home Values in the Area
Average Home Value in this Area
Purchase History
| Date | Buyer | Sale Price | Title Company |
|---|---|---|---|
| Main Homes Llc | -- | Performance Title Inc | |
| Octagon Holdings Llc | $18,200 | None Available | |
| Liberty Savings Bank Fsb | $34,000 | None Available | |
| Secretary Of Hud | -- | None Available | |
| Saalman Tara T | $65,000 | Platinum Title Services | |
| Weber Fred | $70,000 | -- |
Source: Public Records
Mortgage History
| Date | Status | Borrower | Loan Amount |
|---|---|---|---|
| Open | Main Homes Llc | $2,550,000 | |
| Previous Owner | Saalman Tara T | $63,822 |
Source: Public Records
Tax History
| Year | Tax Paid | Tax Assessment Tax Assessment Total Assessment is a certain percentage of the fair market value that is determined by local assessors to be the total taxable value of land and additions on the property. | Land | Improvement |
|---|---|---|---|---|
| 2025 | $995 | $16,620 | $4,850 | $11,770 |
| 2024 | $970 | $16,620 | $4,850 | $11,770 |
| 2023 | $970 | $16,620 | $4,850 | $11,770 |
| 2022 | $956 | $12,130 | $3,540 | $8,590 |
| 2021 | $951 | $12,130 | $3,540 | $8,590 |
| 2020 | $949 | $12,130 | $3,540 | $8,590 |
| 2019 | $1,063 | $12,140 | $3,540 | $8,600 |
| 2018 | $1,064 | $12,140 | $3,540 | $8,600 |
| 2017 | $1,057 | $12,140 | $3,540 | $8,600 |
| 2016 | $1,486 | $16,690 | $3,540 | $13,150 |
| 2015 | $1,377 | $16,690 | $3,540 | $13,150 |
| 2014 | $1,377 | $16,690 | $3,540 | $13,150 |
| 2012 | -- | $22,750 | $5,250 | $17,500 |
Source: Public Records
Map
Nearby Homes
- 49 Pointview Ave
- 21 Pointview Ave
- 15 W Maplewood Ave
- 2805 N Main St
- 128 Pointview Ave Unit 2
- 124 Knecht Dr
- 44 E Beechwood Ave
- 43 Knecht Dr
- 104 E Beechwood Ave
- 128 E Bruce Ave
- 423 Sandalwood Dr
- 417 Sandalwood Dr
- 156 E Hillcrest Ave
- 232 E Bruce Ave
- 2624 Newport Ave
- 11 Pinehurst Ave
- 3303 N Main St
- 25 Laura Ave
- 301 Fernwood Ave
- 29 Laura Ave
- 32 E Maplewood Ave
- 36 E Maplewood Ave
- 15 E Hillcrest Ave
- 2916 N Main St
- 2912 N Main St
- 44 E Maplewood Ave
- 2920 N Main St
- 2908 N Main St
- 27 E Maplewood Ave
- 31 E Maplewood Ave
- 21 E Maplewood Ave
- 2924 N Main St
- 2906 N Main St
- 25 E Hillcrest Ave
- 35 E Maplewood Ave
- 48 E Maplewood Ave
- 27 E Hillcrest Ave
- 2900 N Main St
- 39 E Maplewood Ave
- 13 E Maplewood Ave
Your Personal Tour Guide
Ask me questions while you tour the home.