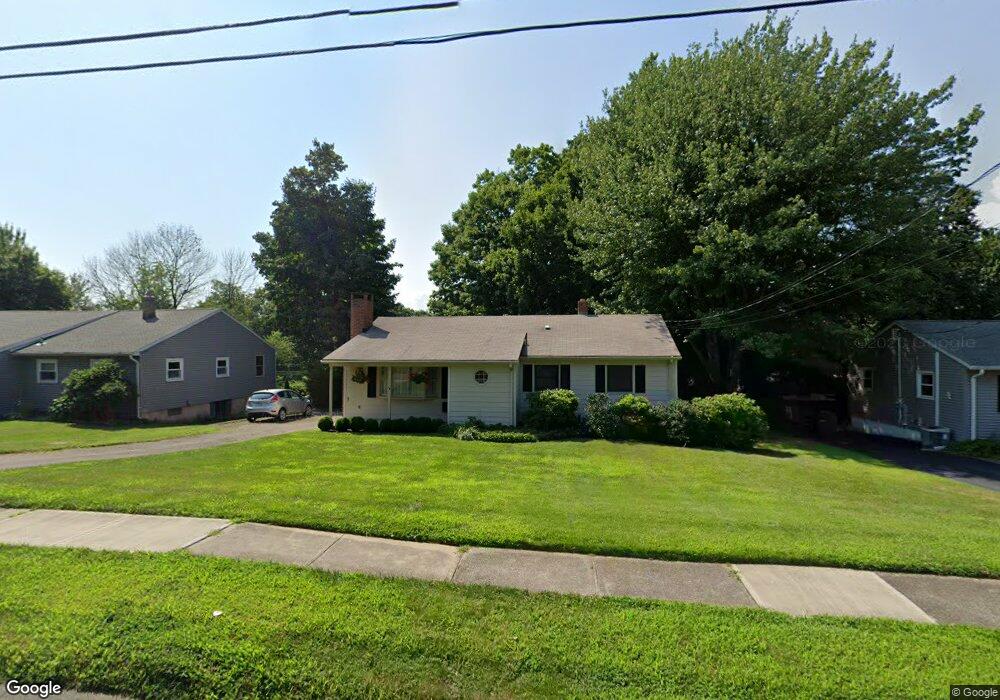
28 Easy St Milford, CT 06460
East Milford NeighborhoodEstimated Value: $429,994 - $464,000
2
Beds
1
Bath
1,008
Sq Ft
$439/Sq Ft
Est. Value
About This Home
This home is located at 28 Easy St, Milford, CT 06460 and is currently estimated at $442,249, approximately $438 per square foot. 28 Easy St is a home located in New Haven County with nearby schools including Orchard Hills School, East Shore Middle School, and Joseph A. Foran High School.
Ownership History
Date
Name
Owned For
Owner Type
Purchase Details
Closed on
May 22, 1992
Sold by
Bennett Victor M and Bennett Angele C
Bought by
Skok Robert W and Skok Kathleen
Current Estimated Value
Home Financials for this Owner
Home Financials are based on the most recent Mortgage that was taken out on this home.
Original Mortgage
$125,000
Interest Rate
8.77%
Mortgage Type
Purchase Money Mortgage
Create a Home Valuation Report for This Property
The Home Valuation Report is an in-depth analysis detailing your home's value as well as a comparison with similar homes in the area
Home Values in the Area
Average Home Value in this Area
Purchase History
| Date | Buyer | Sale Price | Title Company |
|---|---|---|---|
| Skok Robert W | $140,000 | -- |
Source: Public Records
Mortgage History
| Date | Status | Borrower | Loan Amount |
|---|---|---|---|
| Closed | Skok Robert W | $117,000 | |
| Closed | Skok Robert W | $125,000 |
Source: Public Records
Tax History Compared to Growth
Tax History
| Year | Tax Paid | Tax Assessment Tax Assessment Total Assessment is a certain percentage of the fair market value that is determined by local assessors to be the total taxable value of land and additions on the property. | Land | Improvement |
|---|---|---|---|---|
| 2025 | $6,149 | $208,080 | $98,960 | $109,120 |
| 2024 | $6,063 | $208,080 | $98,960 | $109,120 |
| 2023 | $5,654 | $208,080 | $98,960 | $109,120 |
| 2022 | $5,545 | $208,080 | $98,960 | $109,120 |
| 2021 | $4,857 | $175,670 | $69,300 | $106,370 |
| 2020 | $4,863 | $175,670 | $69,300 | $106,370 |
| 2019 | $4,868 | $175,670 | $69,300 | $106,370 |
| 2018 | $4,873 | $175,670 | $69,300 | $106,370 |
| 2017 | $4,882 | $175,670 | $69,300 | $106,370 |
| 2016 | $4,691 | $168,500 | $69,300 | $99,200 |
| 2015 | $4,698 | $168,500 | $69,300 | $99,200 |
| 2014 | $4,587 | $168,500 | $69,300 | $99,200 |
Source: Public Records
Map
Nearby Homes
- 470 Pond Point Ave
- 25 Carmen Rd
- 565 Pond Point Ave
- 571 Pond Point Ave
- 126 Baxter Ln
- 105 Carriage Path S Unit 105 Carriage Path So
- 30 Gerard St
- 43 Ridgewood Dr
- 180 Melba St Unit 205
- 141 Ridgewood Dr
- 34 Orchard Rd
- 44 Chester St
- 71 Platt St
- 12 Norwood Ave
- 32 Burwell Ave
- 22 Hillside Ave
- 5 Vine St
- 44 Beachland Ave
- 75 Long Island View Rd
- 44 Clark Hill Rd