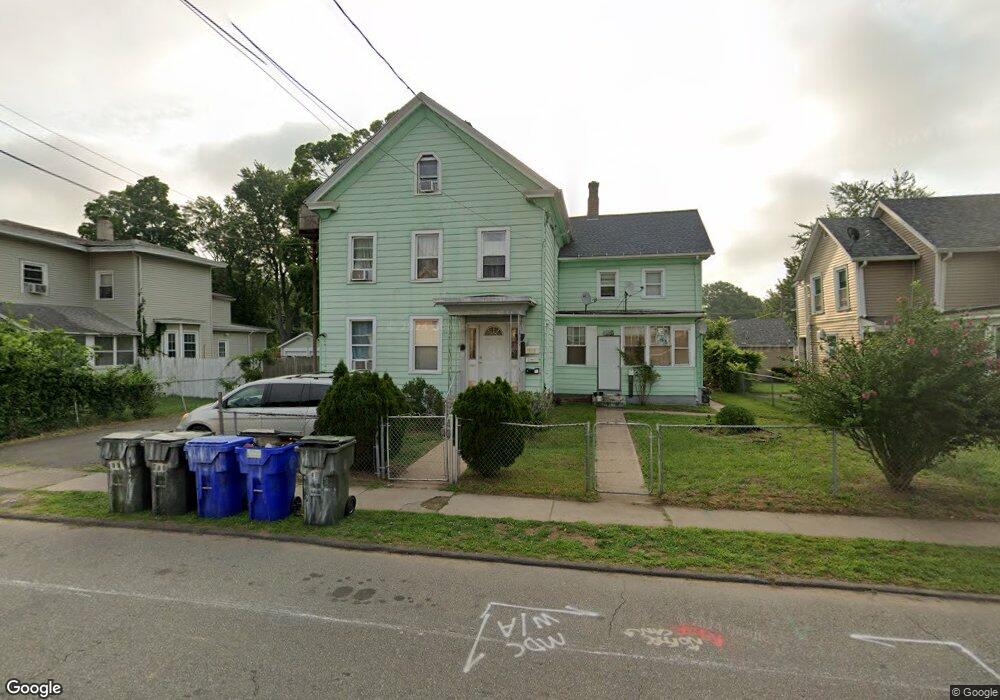
28 Elm St East Hartford, CT 06108
Estimated Value: $363,000 - $405,000
6
Beds
4
Baths
3,328
Sq Ft
$117/Sq Ft
Est. Value
About This Home
This home is located at 28 Elm St, East Hartford, CT 06108 and is currently estimated at $389,683, approximately $117 per square foot. 28 Elm St is a home located in Hartford County with nearby schools including Robert J. O'Brien School, East Hartford Middle School, and East Hartford High School.
Ownership History
Date
Name
Owned For
Owner Type
Purchase Details
Closed on
Sep 6, 2018
Sold by
Hsiao Dang and Le Luu P
Bought by
Mitra Sumit and Mitra Sudakshina
Current Estimated Value
Purchase Details
Closed on
Feb 1, 2002
Sold by
Sanchez Jose M and Sanchez Luz M
Bought by
Hsiao Dang
Home Financials for this Owner
Home Financials are based on the most recent Mortgage that was taken out on this home.
Original Mortgage
$130,000
Interest Rate
7.15%
Mortgage Type
Purchase Money Mortgage
Purchase Details
Closed on
Jan 2, 1997
Sold by
Disanzo Rosina and Siciliano Domenica
Bought by
Sanchez Jose M and Rodirguez Luz M
Home Financials for this Owner
Home Financials are based on the most recent Mortgage that was taken out on this home.
Original Mortgage
$75,600
Interest Rate
7.48%
Mortgage Type
Purchase Money Mortgage
Create a Home Valuation Report for This Property
The Home Valuation Report is an in-depth analysis detailing your home's value as well as a comparison with similar homes in the area
Home Values in the Area
Average Home Value in this Area
Purchase History
| Date | Buyer | Sale Price | Title Company |
|---|---|---|---|
| Mitra Sumit | $85,000 | -- | |
| Hsiao Dang | $163,000 | -- | |
| Sanchez Jose M | $84,000 | -- |
Source: Public Records
Mortgage History
| Date | Status | Borrower | Loan Amount |
|---|---|---|---|
| Previous Owner | Sanchez Jose M | $130,000 | |
| Previous Owner | Sanchez Jose M | $116,500 | |
| Previous Owner | Sanchez Jose M | $110,400 | |
| Previous Owner | Sanchez Jose M | $75,600 |
Source: Public Records
Tax History Compared to Growth
Tax History
| Year | Tax Paid | Tax Assessment Tax Assessment Total Assessment is a certain percentage of the fair market value that is determined by local assessors to be the total taxable value of land and additions on the property. | Land | Improvement |
|---|---|---|---|---|
| 2025 | $8,320 | $181,270 | $35,200 | $146,070 |
| 2024 | $7,976 | $181,270 | $35,200 | $146,070 |
| 2023 | $7,711 | $181,270 | $35,200 | $146,070 |
| 2022 | $7,432 | $181,270 | $35,200 | $146,070 |
| 2021 | $6,714 | $136,050 | $26,660 | $109,390 |
| 2020 | $6,792 | $136,050 | $26,660 | $109,390 |
| 2019 | $6,681 | $136,050 | $26,660 | $109,390 |
| 2018 | $6,467 | $135,680 | $26,660 | $109,020 |
| 2017 | $6,384 | $135,680 | $26,660 | $109,020 |
| 2016 | $6,265 | $136,610 | $28,330 | $108,280 |
| 2015 | $6,265 | $136,610 | $28,330 | $108,280 |
| 2014 | $6,202 | $136,610 | $28,330 | $108,280 |
Source: Public Records
Map
Nearby Homes
- 47 Elm St
- 62 Wells Ave
- 52 Burnside Ave
- 41 Bissell St
- 98 Olmsted St
- 85R Olmsted St
- 181 Burnside Ave
- 59 Tolland St
- 61 Central Ave Unit 63
- 10 Kenyon Place
- 279 Prospect St
- 88 Governor St Unit 90
- 265 Burnside Ave
- 1589 Main St
- 347 Prospect St Unit 349
- 30 Oakwood St
- 115 Governor St
- 11 Westbrook St
- 50 Garvan St
- 16 Whitney St