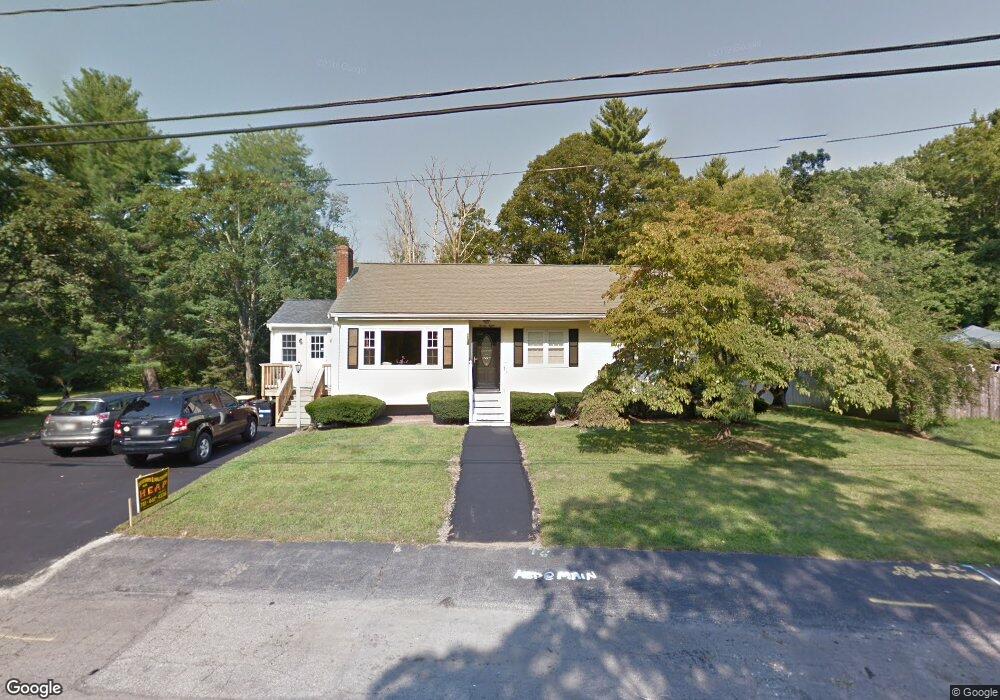
28 Elmer Rd South Weymouth, MA 02190
South Weymouth NeighborhoodEstimated Value: $787,660 - $863,000
3
Beds
4
Baths
2,120
Sq Ft
$387/Sq Ft
Est. Value
About This Home
This home is located at 28 Elmer Rd, South Weymouth, MA 02190 and is currently estimated at $819,915, approximately $386 per square foot. 28 Elmer Rd is a home located in Norfolk County with nearby schools including Thomas W. Hamilton Primary School, Abigail Adams Middle School, and Weymouth Middle School Chapman.
Ownership History
Date
Name
Owned For
Owner Type
Purchase Details
Closed on
Jan 13, 1995
Sold by
Mcclelland Kermin J and Mcclelland Maryj
Bought by
Kabachus John C and Kabuchus June M
Current Estimated Value
Create a Home Valuation Report for This Property
The Home Valuation Report is an in-depth analysis detailing your home's value as well as a comparison with similar homes in the area
Home Values in the Area
Average Home Value in this Area
Purchase History
| Date | Buyer | Sale Price | Title Company |
|---|---|---|---|
| Kabachus John C | $151,900 | -- |
Source: Public Records
Mortgage History
| Date | Status | Borrower | Loan Amount |
|---|---|---|---|
| Open | Kabachus John C | $239,000 | |
| Closed | Kabachus John C | $30,000 | |
| Closed | Kabachus John C | $140,700 |
Source: Public Records
Tax History Compared to Growth
Tax History
| Year | Tax Paid | Tax Assessment Tax Assessment Total Assessment is a certain percentage of the fair market value that is determined by local assessors to be the total taxable value of land and additions on the property. | Land | Improvement |
|---|---|---|---|---|
| 2025 | $7,648 | $757,200 | $240,600 | $516,600 |
| 2024 | $7,382 | $718,800 | $229,100 | $489,700 |
| 2023 | $7,226 | $691,500 | $231,500 | $460,000 |
| 2022 | $7,072 | $617,100 | $214,300 | $402,800 |
| 2021 | $6,525 | $555,800 | $214,300 | $341,500 |
| 2020 | $6,316 | $529,900 | $214,300 | $315,600 |
| 2019 | $6,060 | $500,000 | $206,100 | $293,900 |
| 2018 | $5,904 | $472,300 | $196,300 | $276,000 |
| 2017 | $5,766 | $450,100 | $187,000 | $263,100 |
| 2016 | $5,582 | $436,100 | $179,800 | $256,300 |
| 2015 | $5,369 | $416,200 | $179,800 | $236,400 |
| 2014 | $4,934 | $371,000 | $167,300 | $203,700 |
Source: Public Records
Map
Nearby Homes
- 250 Thicket St
- 57 Sheri Ln
- 44 Old Forge Rd
- 14 Jamieson St
- 130 Trotter Rd Unit 1309
- 130 Trotter Rd Unit 1211
- 25 Skyhawk Cir
- 14 Kingswood Dr Unit 3
- 8 Kingswood Dr Unit D5
- 1 Sparrow Green
- 337 Randolph St
- 1085 Bedford St
- 1077 Bedford St
- 11 Woodcrest Ct Unit 5
- 10 Woodcrest Ct Unit 4
- 8 Woodcrest Ct Unit 4
- 82 Snowbird Ave
- 7 Woodcrest Ct Unit 4
- 169 Pond St
- 5 Chamberlain St