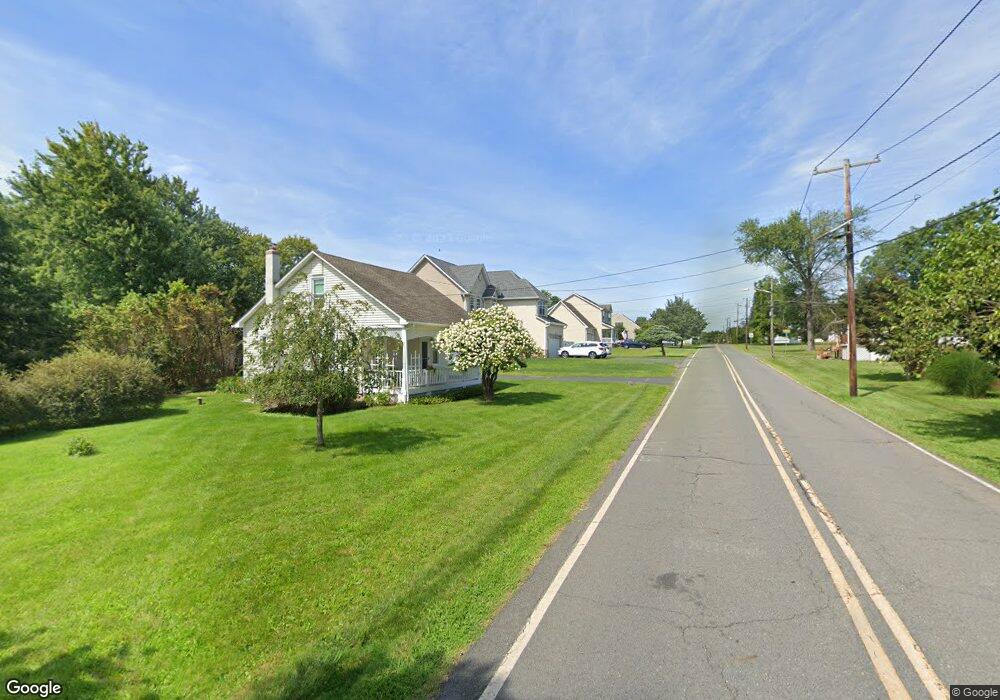
28 Equator Ave Flagtown, NJ 08821
Estimated Value: $770,000 - $888,098
Studio
--
Bath
2,602
Sq Ft
$316/Sq Ft
Est. Value
About This Home
This home is located at 28 Equator Ave, Flagtown, NJ 08821 and is currently estimated at $823,025, approximately $316 per square foot. 28 Equator Ave is a home located in Somerset County with nearby schools including Hillsborough High School, Cherry Blossom Montessori School, and Brighthorizons at Hillsborough.
Ownership History
Date
Name
Owned For
Owner Type
Purchase Details
Closed on
Apr 28, 2021
Sold by
Zp Builders Llc
Bought by
Vaid Vinod K and Mehta Meera R
Current Estimated Value
Home Financials for this Owner
Home Financials are based on the most recent Mortgage that was taken out on this home.
Original Mortgage
$508,300
Outstanding Balance
$459,926
Interest Rate
3%
Mortgage Type
New Conventional
Estimated Equity
$363,099
Purchase Details
Closed on
Jan 22, 2021
Sold by
Zp Builders Llc
Bought by
Vaid Vinod K and Mehta Meera R
Home Financials for this Owner
Home Financials are based on the most recent Mortgage that was taken out on this home.
Original Mortgage
$508,300
Interest Rate
3%
Mortgage Type
New Conventional
Purchase Details
Closed on
Nov 18, 2019
Sold by
Marchine Sherry A and Marchine Sherry A
Bought by
Zp Builders Llc
Purchase Details
Closed on
Mar 26, 2019
Sold by
Estate Of George R Farley
Bought by
Farley Marlene M and Marchie Sherry A
Create a Home Valuation Report for This Property
The Home Valuation Report is an in-depth analysis detailing your home's value as well as a comparison with similar homes in the area
Home Values in the Area
Average Home Value in this Area
Purchase History
| Date | Buyer | Sale Price | Title Company |
|---|---|---|---|
| Vaid Vinod K | $598,000 | Chicago Title | |
| Vaid Vinod K | $598,000 | Chicago Title Insurance Co | |
| Zp Builders Llc | $132,000 | None Available | |
| Farley Marlene M | -- | None Available |
Source: Public Records
Mortgage History
| Date | Status | Borrower | Loan Amount |
|---|---|---|---|
| Open | Vaid Vinod K | $508,300 | |
| Previous Owner | Vaid Vinod K | $508,300 |
Source: Public Records
Tax History
| Year | Tax Paid | Tax Assessment Tax Assessment Total Assessment is a certain percentage of the fair market value that is determined by local assessors to be the total taxable value of land and additions on the property. | Land | Improvement |
|---|---|---|---|---|
| 2025 | $13,955 | $739,100 | $301,500 | $437,600 |
| 2024 | $13,955 | $651,200 | $282,700 | $368,500 |
Source: Public Records
Map
Nearby Homes
- 63 Beechwood Cir
- 99 Beechwood Cir
- 10 Raker Ct
- 7 Wolverton Ln
- 53 E Mountain Rd
- 45 Van Zandt Dr
- 0 Amwell Rd
- 718 Mill Ln
- 91 Devonshire Ct Unit 91
- 46 Dorchester Ct
- 13 Crestmont Dr
- 202 Daval Rd
- 619 van Liew Ct
- 267 Gemini Dr Unit 1B
- 141 Terhune Ln
- 251 Gemini Dr Unit 1C
- 124 Bluebird Dr
- 4 Updike Ave
- 107 Bluebird Dr Unit 1A
- 3011 Revere Ct
Your Personal Tour Guide
Ask me questions while you tour the home.