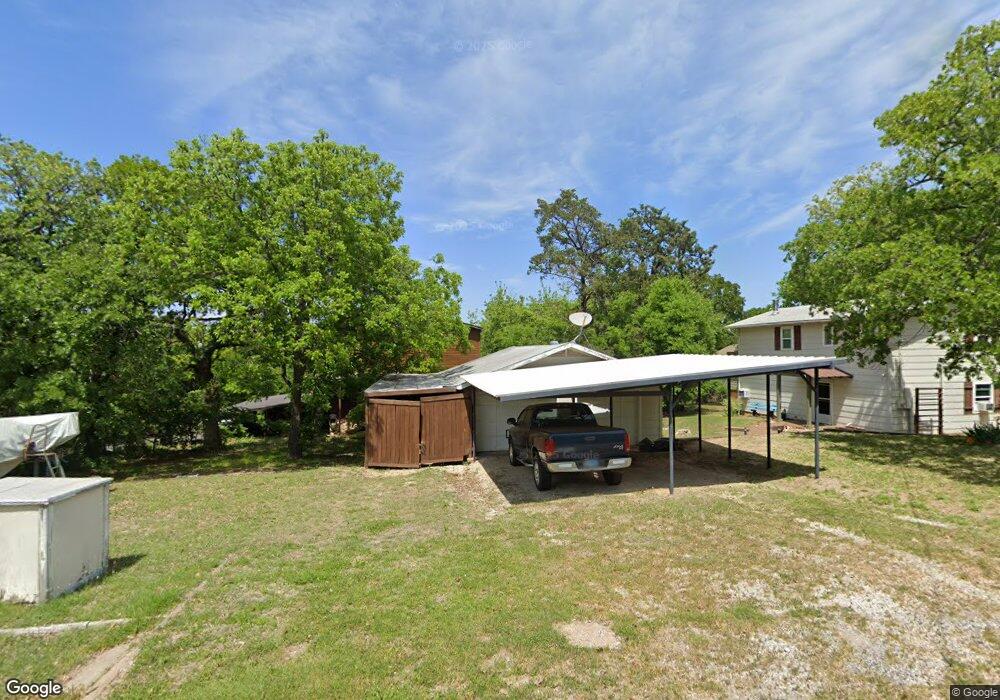
28 Erin Dr Pottsboro, TX 75076
Estimated Value: $262,733 - $381,000
2
Beds
2
Baths
1,300
Sq Ft
$263/Sq Ft
Est. Value
About This Home
This home is located at 28 Erin Dr, Pottsboro, TX 75076 and is currently estimated at $341,433, approximately $262 per square foot. 28 Erin Dr is a home located in Grayson County with nearby schools including Pottsboro Elementary School, Pottsboro Middle School, and Pottsboro High School.
Ownership History
Date
Name
Owned For
Owner Type
Purchase Details
Closed on
Dec 21, 2020
Sold by
Winkler Douglas Warren and Winkler Nancy Lyn
Bought by
Winkler Douglas Warren and Winkler Nancy Lyn
Current Estimated Value
Purchase Details
Closed on
Apr 13, 2012
Sold by
Whitlock Joshua and Whitlock Erica
Bought by
Blatz Jean
Purchase Details
Closed on
Jul 6, 2006
Sold by
Household Finance Corp Iii
Bought by
Whitlock Joshua
Home Financials for this Owner
Home Financials are based on the most recent Mortgage that was taken out on this home.
Original Mortgage
$44,000
Interest Rate
6.66%
Mortgage Type
Purchase Money Mortgage
Purchase Details
Closed on
Jan 3, 2006
Sold by
Mortgage Electronic Registration Systems
Bought by
Household Finance Corp Iii
Create a Home Valuation Report for This Property
The Home Valuation Report is an in-depth analysis detailing your home's value as well as a comparison with similar homes in the area
Home Values in the Area
Average Home Value in this Area
Purchase History
| Date | Buyer | Sale Price | Title Company |
|---|---|---|---|
| Winkler Douglas Warren | -- | None Available | |
| Blatz Jean | -- | Chapin Title Co Inc | |
| Whitlock Joshua | -- | Chapin Title Co Inc | |
| Household Finance Corp Iii | -- | None Available | |
| Mortgage Electronic Registration Systems | $69,920 | None Available |
Source: Public Records
Mortgage History
| Date | Status | Borrower | Loan Amount |
|---|---|---|---|
| Previous Owner | Whitlock Joshua | $44,000 |
Source: Public Records
Tax History Compared to Growth
Tax History
| Year | Tax Paid | Tax Assessment Tax Assessment Total Assessment is a certain percentage of the fair market value that is determined by local assessors to be the total taxable value of land and additions on the property. | Land | Improvement |
|---|---|---|---|---|
| 2025 | $2,559 | $180,791 | $52,248 | $128,543 |
| 2024 | $2,559 | $184,703 | $56,952 | $127,751 |
| 2023 | $2,180 | $157,067 | $28,757 | $128,310 |
| 2022 | $2,212 | $140,534 | $20,244 | $120,290 |
| 2021 | $1,836 | $112,911 | $26,604 | $86,307 |
| 2020 | $1,906 | $112,911 | $26,604 | $86,307 |
| 2019 | $1,798 | $101,640 | $29,496 | $72,144 |
| 2018 | $1,669 | $93,145 | $23,712 | $69,433 |
| 2017 | $1,563 | $86,113 | $23,712 | $62,401 |
| 2016 | $1,534 | $84,506 | $23,712 | $60,794 |
| 2015 | $1,434 | $77,641 | $23,712 | $53,929 |
| 2014 | $1,410 | $75,701 | $23,712 | $51,989 |
Source: Public Records
Map
Nearby Homes
- 11 Mayfield Ln
- 83 Mayfield Ln
- 545 Black Forest Dr
- 344 Castle Dr
- 491 Black Forest Dr
- 226 Cambridge Dr
- 142 Wales Dr
- 34 Cambridge Dr
- 219 Ray Rd
- 16 Wales Dr
- 81 Windsor Dr
- 191 Black Forest Dr
- 207 Wales Dr
- 33 Queens Dr
- 116 Oak Hills Dr
- 110 Eagleview Cir
- 120 Eagleview Cir
- 258 Lou-Sand Hill Rd
- 105 Eagleview Cir
- 766 Lakepoint Loop