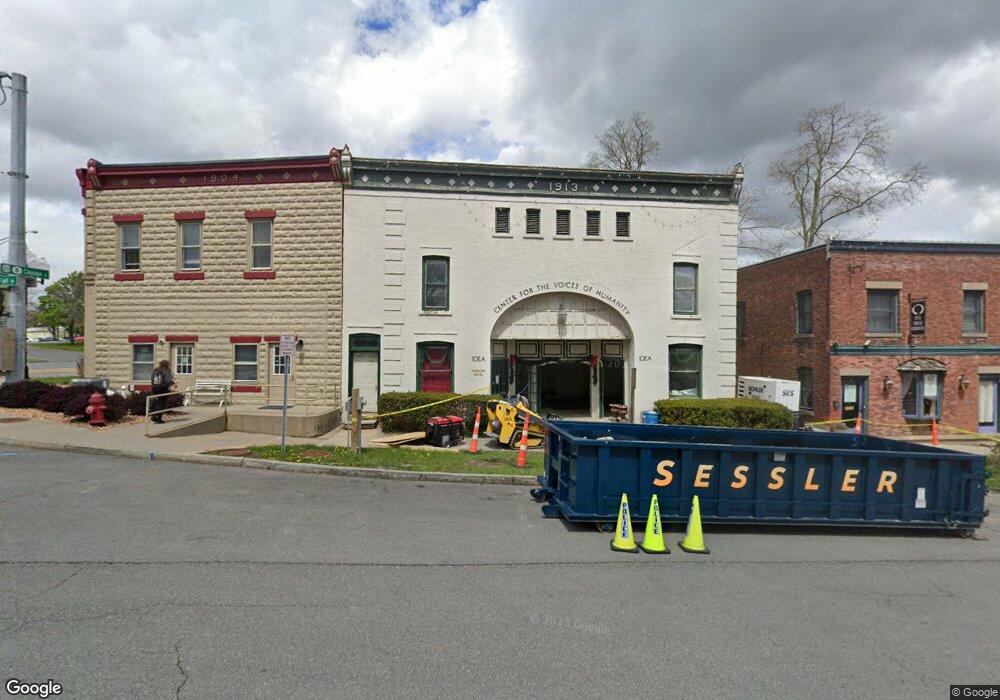
28 Fall St Unit 2 Seneca Falls, NY 13148
Estimated Value: $173,105
Studio
--
Bath
1,703
Sq Ft
$102/Sq Ft
Est. Value
About This Home
This home is located at 28 Fall St Unit 2, Seneca Falls, NY 13148 and is currently estimated at $173,105, approximately $101 per square foot. 28 Fall St Unit 2 is a home located in Seneca County with nearby schools including Frank M. Knight Elementary School, Elizabeth Cady Stanton Elementary School, and Seneca Falls Middle School.
Ownership History
Date
Name
Owned For
Owner Type
Purchase Details
Closed on
May 2, 2023
Sold by
Collins Todd and Collins Jenny
Bought by
239 Stanhope Llc
Current Estimated Value
Purchase Details
Closed on
Jun 14, 2019
Sold by
Duvall Suzanne
Bought by
Collins Todd
Home Financials for this Owner
Home Financials are based on the most recent Mortgage that was taken out on this home.
Original Mortgage
$114,400
Interest Rate
4%
Mortgage Type
New Conventional
Purchase Details
Closed on
Feb 5, 1996
Sold by
Bidwell Donald W
Bought by
Du Vall Suzanne
Create a Home Valuation Report for This Property
The Home Valuation Report is an in-depth analysis detailing your home's value as well as a comparison with similar homes in the area
Home Values in the Area
Average Home Value in this Area
Purchase History
| Date | Buyer | Sale Price | Title Company |
|---|---|---|---|
| 239 Stanhope Llc | $135,000 | None Available | |
| Collins Todd | $142,999 | -- | |
| Du Vall Suzanne | $69,000 | -- |
Source: Public Records
Mortgage History
| Date | Status | Borrower | Loan Amount |
|---|---|---|---|
| Previous Owner | Collins Todd | $114,400 |
Source: Public Records
Tax History
| Year | Tax Paid | Tax Assessment Tax Assessment Total Assessment is a certain percentage of the fair market value that is determined by local assessors to be the total taxable value of land and additions on the property. | Land | Improvement |
|---|---|---|---|---|
| 2024 | $3,734 | $125,000 | $17,100 | $107,900 |
| 2023 | $37 | $125,000 | $17,100 | $107,900 |
| 2022 | $4,155 | $90,000 | $14,000 | $76,000 |
| 2021 | $4,127 | $90,000 | $14,000 | $76,000 |
| 2020 | $4,116 | $90,000 | $14,000 | $76,000 |
| 2019 | $1,686 | $90,000 | $14,000 | $76,000 |
| 2018 | $3,992 | $90,000 | $14,000 | $76,000 |
| 2017 | $3,955 | $90,000 | $14,000 | $76,000 |
| 2016 | $3,393 | $90,000 | $14,000 | $76,000 |
| 2015 | -- | $78,000 | $12,200 | $65,800 |
| 2014 | -- | $78,000 | $12,200 | $65,800 |
Source: Public Records
Map
Nearby Homes