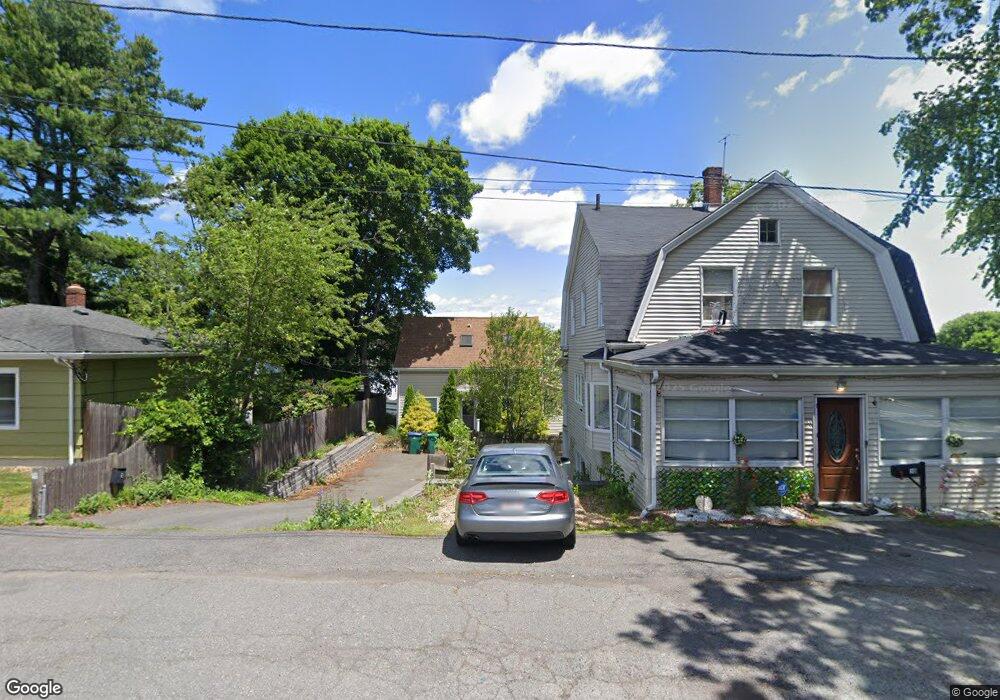
28 Fay St Lynn, MA 01902
Chatham Street NeighborhoodEstimated Value: $496,199 - $574,000
2
Beds
2
Baths
1,064
Sq Ft
$505/Sq Ft
Est. Value
About This Home
This home is located at 28 Fay St, Lynn, MA 01902 and is currently estimated at $537,300, approximately $504 per square foot. 28 Fay St is a home located in Essex County with nearby schools including Hood Elementary School, William R. Fallon School, and Marshall Middle School.
Ownership History
Date
Name
Owned For
Owner Type
Purchase Details
Closed on
Jun 16, 2009
Sold by
Campbell Jelaine
Bought by
Moran Laurie A
Current Estimated Value
Home Financials for this Owner
Home Financials are based on the most recent Mortgage that was taken out on this home.
Original Mortgage
$188,491
Outstanding Balance
$119,412
Interest Rate
4.82%
Mortgage Type
Purchase Money Mortgage
Estimated Equity
$417,888
Purchase Details
Closed on
Jun 29, 2005
Sold by
Spates Hilda L and Spates William F
Bought by
Campbell Jelaine
Purchase Details
Closed on
May 28, 2003
Sold by
Crissinger David A and Crissinger Gail A
Bought by
Spates William F
Create a Home Valuation Report for This Property
The Home Valuation Report is an in-depth analysis detailing your home's value as well as a comparison with similar homes in the area
Home Values in the Area
Average Home Value in this Area
Purchase History
| Date | Buyer | Sale Price | Title Company |
|---|---|---|---|
| Moran Laurie A | $195,000 | -- | |
| Moran Laurie A | $195,000 | -- | |
| Campbell Jelaine | $270,000 | -- | |
| Campbell Jelaine | $270,000 | -- | |
| Spates William F | $100,000 | -- | |
| Spates William F | $100,000 | -- |
Source: Public Records
Mortgage History
| Date | Status | Borrower | Loan Amount |
|---|---|---|---|
| Open | Spates William F | $188,491 | |
| Closed | Spates William F | $188,491 | |
| Previous Owner | Spates William F | $130,500 |
Source: Public Records
Tax History Compared to Growth
Tax History
| Year | Tax Paid | Tax Assessment Tax Assessment Total Assessment is a certain percentage of the fair market value that is determined by local assessors to be the total taxable value of land and additions on the property. | Land | Improvement |
|---|---|---|---|---|
| 2025 | $4,617 | $445,700 | $165,200 | $280,500 |
| 2024 | $4,449 | $422,500 | $157,300 | $265,200 |
| 2023 | $4,309 | $386,500 | $153,400 | $233,100 |
| 2022 | $4,375 | $352,000 | $143,000 | $209,000 |
| 2021 | $4,155 | $318,900 | $123,400 | $195,500 |
| 2020 | $3,982 | $297,200 | $116,600 | $180,600 |
| 2019 | $3,997 | $279,500 | $109,000 | $170,500 |
| 2018 | $3,788 | $250,000 | $106,200 | $143,800 |
| 2017 | $3,301 | $211,600 | $93,700 | $117,900 |
| 2016 | $3,145 | $194,400 | $82,900 | $111,500 |
| 2015 | $2,899 | $173,100 | $75,300 | $97,800 |
Source: Public Records
Map
Nearby Homes
- 605 Eastern Ave Unit 211
- 20 Lexington St
- 101 Maple St
- 431-433 Chatham St
- 32 Clarendon Ave
- 22 Burdett Rd
- 6A Goodridge St
- 27-29 Graves Ave
- 31 Madison St
- 6 Washburn St
- 31 Atkins Ave
- 44 Eutaw Ave
- 25 E Park Ave
- 112 Fays Ave
- 44 Valley Rd
- 106 Goodridge St
- 73 Lockwood Rd
- 31 Spring View Dr
- 35 Allen Ave
- 39 Kelly Ln