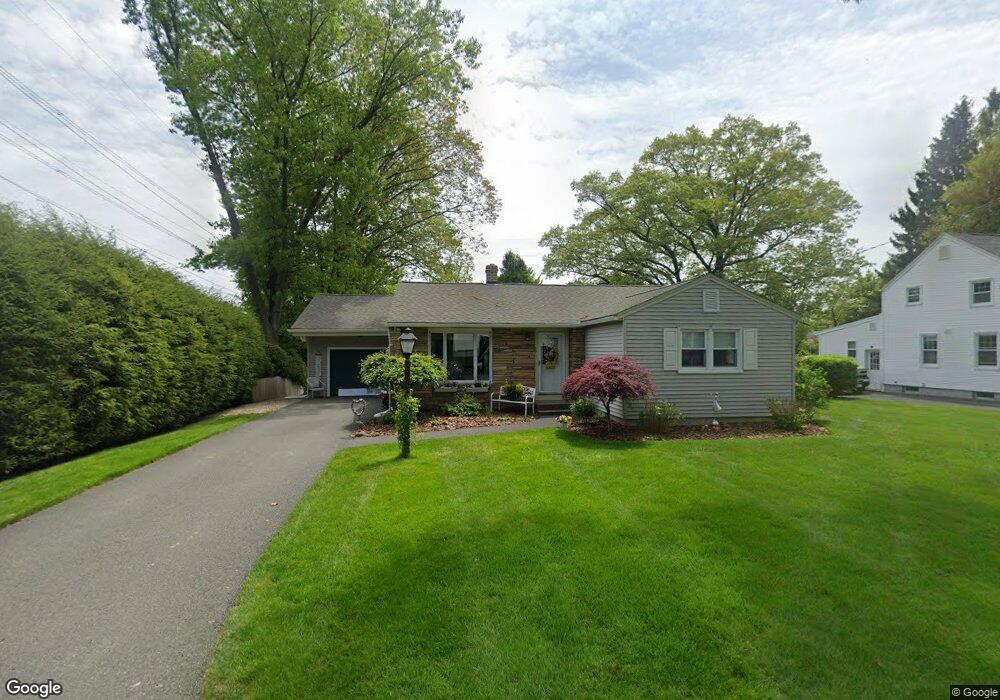
28 Fenor St West Springfield, MA 01089
Estimated Value: $284,775 - $299,000
2
Beds
1
Bath
1,108
Sq Ft
$265/Sq Ft
Est. Value
About This Home
This home is located at 28 Fenor St, West Springfield, MA 01089 and is currently estimated at $293,444, approximately $264 per square foot. 28 Fenor St is a home located in Hampden County with nearby schools including St Thomas The Apostle School.
Ownership History
Date
Name
Owned For
Owner Type
Purchase Details
Closed on
Jan 30, 2024
Sold by
Blakesley Elena L
Bought by
Blakesley Ft and Jasak
Current Estimated Value
Purchase Details
Closed on
Mar 14, 2014
Sold by
Blakesly Thomas M and Blakesly Elena L
Bought by
Blakesly Elena L
Create a Home Valuation Report for This Property
The Home Valuation Report is an in-depth analysis detailing your home's value as well as a comparison with similar homes in the area
Home Values in the Area
Average Home Value in this Area
Purchase History
| Date | Buyer | Sale Price | Title Company |
|---|---|---|---|
| Blakesley Ft | -- | None Available | |
| Blakesley Ft | -- | None Available | |
| Blakesly Elena L | -- | -- | |
| Blakesly Elena L | -- | -- |
Source: Public Records
Mortgage History
| Date | Status | Borrower | Loan Amount |
|---|---|---|---|
| Previous Owner | Blakesly Elena L | $30,000 | |
| Previous Owner | Blakesly Elena L | $79,900 | |
| Previous Owner | Blakesly Elena L | $92,000 |
Source: Public Records
Tax History Compared to Growth
Tax History
| Year | Tax Paid | Tax Assessment Tax Assessment Total Assessment is a certain percentage of the fair market value that is determined by local assessors to be the total taxable value of land and additions on the property. | Land | Improvement |
|---|---|---|---|---|
| 2025 | $3,542 | $238,200 | $87,800 | $150,400 |
| 2024 | $3,183 | $214,900 | $87,800 | $127,100 |
| 2023 | $3,005 | $193,400 | $85,900 | $107,500 |
| 2022 | $2,714 | $172,200 | $78,000 | $94,200 |
| 2021 | $2,669 | $157,900 | $73,100 | $84,800 |
| 2020 | $2,598 | $152,900 | $73,100 | $79,800 |
| 2019 | $2,593 | $152,900 | $73,100 | $79,800 |
| 2018 | $2,607 | $152,900 | $73,100 | $79,800 |
| 2017 | $2,607 | $152,900 | $73,100 | $79,800 |
| 2016 | $2,542 | $149,600 | $68,700 | $80,900 |
| 2015 | $2,492 | $146,700 | $67,300 | $79,400 |
| 2014 | $604 | $146,700 | $67,300 | $79,400 |
Source: Public Records
Map
Nearby Homes
- 36 Maple Terrace
- 74 Maple Terrace
- 30 Chestnut St
- 42 Janet St
- 19 Cora St
- 142 Morton St
- 120 Hampden St
- 65 Verdugo St
- 19 Church St
- 50 Howard St
- 61 Clarence St
- 524 Westfield St
- 21 High St
- 16 North St
- 92 Grove St
- Lot 10 Ahiska Rd
- 81 Laurence Dr
- 456 Cold Spring Ave Unit 2A
- 335-337 Springfield St
- 334 Elm St