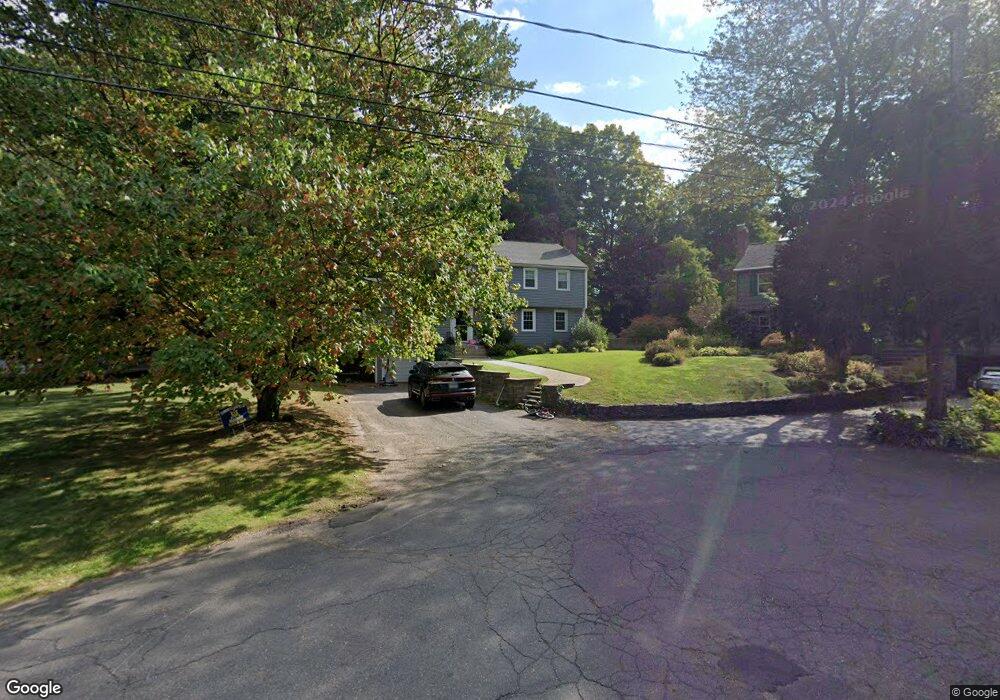
28 Fernbrook West Hartford, CT 06107
Estimated Value: $650,000 - $680,713
3
Beds
3
Baths
2,242
Sq Ft
$297/Sq Ft
Est. Value
About This Home
This home is located at 28 Fernbrook, West Hartford, CT 06107 and is currently estimated at $665,428, approximately $296 per square foot. 28 Fernbrook is a home located in Hartford County with nearby schools including Braeburn School, Sedgwick Middle School, and Conard High School.
Ownership History
Date
Name
Owned For
Owner Type
Purchase Details
Closed on
Sep 20, 2017
Sold by
Laverty John P
Bought by
Laverty Kristi and Laverty John P
Current Estimated Value
Home Financials for this Owner
Home Financials are based on the most recent Mortgage that was taken out on this home.
Original Mortgage
$300,000
Outstanding Balance
$250,521
Interest Rate
3.9%
Mortgage Type
Purchase Money Mortgage
Estimated Equity
$414,907
Purchase Details
Closed on
Jun 30, 1997
Sold by
Nolan Mark R and Nolan Marylyn L
Bought by
Laverty John P
Home Financials for this Owner
Home Financials are based on the most recent Mortgage that was taken out on this home.
Original Mortgage
$160,000
Interest Rate
7.81%
Mortgage Type
Unknown
Create a Home Valuation Report for This Property
The Home Valuation Report is an in-depth analysis detailing your home's value as well as a comparison with similar homes in the area
Home Values in the Area
Average Home Value in this Area
Purchase History
| Date | Buyer | Sale Price | Title Company |
|---|---|---|---|
| Laverty Kristi | $375,000 | -- | |
| Laverty John P | $226,000 | -- |
Source: Public Records
Mortgage History
| Date | Status | Borrower | Loan Amount |
|---|---|---|---|
| Open | Laverty Kristi | $300,000 | |
| Previous Owner | Laverty John P | $320,000 | |
| Previous Owner | Laverty John P | $246,729 | |
| Previous Owner | Laverty John P | $160,000 | |
| Previous Owner | Laverty John P | $189,000 |
Source: Public Records
Tax History Compared to Growth
Tax History
| Year | Tax Paid | Tax Assessment Tax Assessment Total Assessment is a certain percentage of the fair market value that is determined by local assessors to be the total taxable value of land and additions on the property. | Land | Improvement |
|---|---|---|---|---|
| 2025 | $13,798 | $308,120 | $118,700 | $189,420 |
| 2024 | $12,056 | $284,670 | $118,700 | $165,970 |
| 2023 | $11,649 | $284,670 | $118,700 | $165,970 |
| 2022 | $11,580 | $284,670 | $118,700 | $165,970 |
| 2021 | $10,832 | $255,360 | $118,700 | $136,660 |
| 2020 | $10,674 | $255,360 | $111,200 | $144,160 |
| 2019 | $10,674 | $255,360 | $111,160 | $144,200 |
| 2018 | $10,470 | $255,360 | $111,160 | $144,200 |
| 2017 | $10,480 | $255,360 | $111,160 | $144,200 |
| 2016 | $8,706 | $220,360 | $77,910 | $142,450 |
| 2015 | $8,442 | $220,360 | $77,910 | $142,450 |
| 2014 | $8,235 | $220,360 | $77,910 | $142,450 |
Source: Public Records
Map
Nearby Homes
- 37 W Normandy Dr
- 6 W Maxwell Dr
- 269 Mountain Rd
- 95 Clifton Ave
- 14 Cedar Ledge Rd
- 39 Wyndwood Rd
- 37 Sylvan Ave
- 473 Fern St
- 89 N Main St
- 51 Lemay St
- 1925 Boulevard
- 101 N Main St
- 1782 Boulevard
- 2 Arapahoe Rd Unit 308
- 2 Arapahoe Rd Unit 415
- 2 Arapahoe Rd Unit 611
- 2 Arapahoe Rd Unit 613
- 2 Arapahoe Rd Unit 311
- 2 Arapahoe Rd Unit 312
- 2 Arapahoe Rd Unit 510