28 Fielding St Concord, MA 01742
Estimated Value: $1,186,000 - $1,476,881
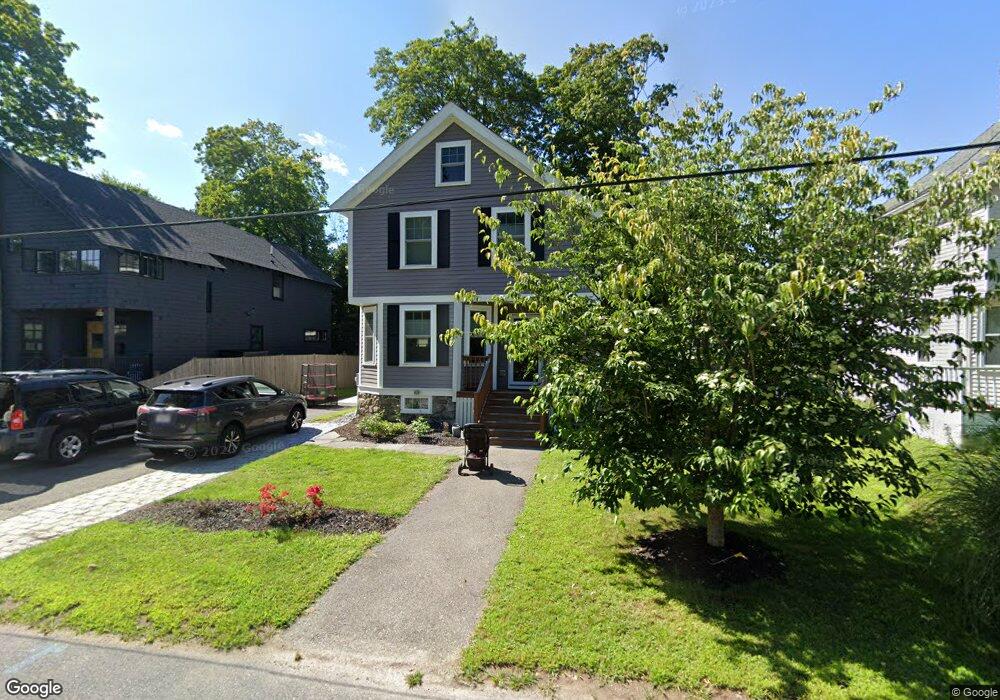
About This Home
This home is located at 28 Fielding St, Concord, MA 01742 and is currently estimated at $1,316,220, approximately $867 per square foot. 28 Fielding St is a home located in Middlesex County with nearby schools including Alcott Elementary School, Concord Middle School, and Concord Carlisle High School.
Ownership History
We collect this data history from publicly available records. To have your information removed, we recommend requesting removal directly through your county’s website.
Purchase Details
Home Financials for this Owner
Home Financials are based on the most recent Mortgage that was taken out on this home.Home Values in the Area
Average Home Value in this Area
Purchase History
We collect this data history from publicly available records. To have your information removed, we recommend requesting removal directly through your county’s website.
| Date | Buyer | Sale Price | Title Company |
|---|---|---|---|
| $350,000 | -- | ||
| $350,000 | -- |
Mortgage History
We collect this data history from publicly available records. To have your information removed, we recommend requesting removal directly through your county’s website.
| Date | Status | Borrower | Loan Amount |
|---|---|---|---|
| Open | $280,000 | ||
| Closed | $280,000 |
Tax History
We collect this data history from publicly available records. To have your information removed, we recommend requesting removal directly through your county’s website.
| Year | Tax Paid | Tax Assessment Tax Assessment Total Assessment is a certain percentage of the fair market value that is determined by local assessors to be the total taxable value of land and additions on the property. | Land | Improvement |
|---|---|---|---|---|
| 2025 | $174 | $1,310,700 | $749,900 | $560,800 |
| 2024 | $16,931 | $1,289,500 | $749,900 | $539,600 |
| 2023 | $13,708 | $1,057,700 | $613,600 | $444,100 |
| 2022 | $14,428 | $977,500 | $490,900 | $486,600 |
| 2021 | $13,375 | $908,600 | $490,900 | $417,700 |
| 2020 | $12,811 | $900,300 | $490,900 | $409,400 |
| 2019 | $12,572 | $886,000 | $511,900 | $374,100 |
| 2018 | $11,116 | $777,900 | $453,900 | $324,000 |
| 2017 | $10,474 | $744,400 | $416,300 | $328,100 |
| 2016 | $9,834 | $706,500 | $416,300 | $290,200 |
| 2015 | $9,244 | $646,900 | $385,400 | $261,500 |
Map
- 24 Fielding St
- 150 Hubbard St Unit B
- 180 Laurel St
- 353 Thoreau St
- 95 Hubbard St
- 46 Sudbury Rd
- 32 Thoreau St Unit 32
- 70 Lexington Rd
- 105 Lexington Rd
- 152 Partridge Ln
- 29 Willard Common
- 59 Martin Rd
- 653 Main St
- 343 Nashawtuc Rd
- 38 Ripley Hill Rd
- 93 Nashoba Rd
- 51 Revolutionary Rd
- 263 Elm St
- 330 Lowell Rd
- 696 Main St
Ask me questions while you tour the home.