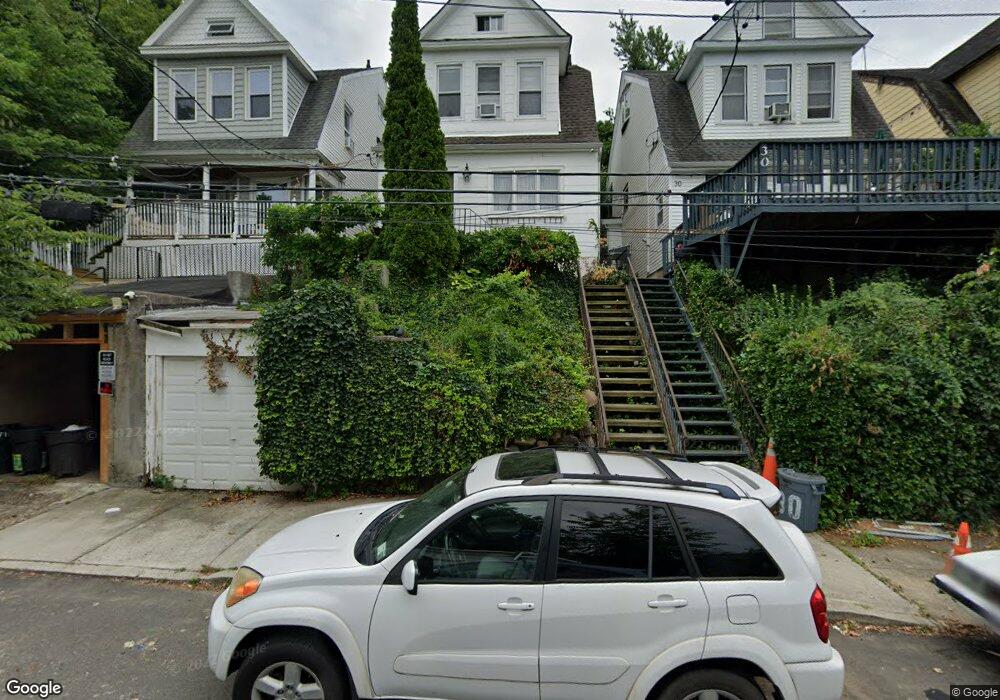
28 Fillmore St Staten Island, NY 10301
New Brighton NeighborhoodEstimated Value: $447,050 - $604,000
--
Bed
4
Baths
1,602
Sq Ft
$325/Sq Ft
Est. Value
About This Home
This home is located at 28 Fillmore St, Staten Island, NY 10301 and is currently estimated at $520,013, approximately $324 per square foot. 28 Fillmore St is a home located in Richmond County with nearby schools including P.S. 45 John Tyler, Is 61 William A Morris, and Curtis High School.
Ownership History
Date
Name
Owned For
Owner Type
Purchase Details
Closed on
Aug 15, 1996
Sold by
Ford John Jo and Ford Gladys
Bought by
Duzant Margaret
Current Estimated Value
Home Financials for this Owner
Home Financials are based on the most recent Mortgage that was taken out on this home.
Original Mortgage
$78,300
Outstanding Balance
$5,668
Interest Rate
7.25%
Estimated Equity
$514,345
Create a Home Valuation Report for This Property
The Home Valuation Report is an in-depth analysis detailing your home's value as well as a comparison with similar homes in the area
Home Values in the Area
Average Home Value in this Area
Purchase History
| Date | Buyer | Sale Price | Title Company |
|---|---|---|---|
| Duzant Margaret | $82,500 | Ticor Title Guarantee Compan |
Source: Public Records
Mortgage History
| Date | Status | Borrower | Loan Amount |
|---|---|---|---|
| Open | Duzant Margaret | $78,300 |
Source: Public Records
Tax History Compared to Growth
Tax History
| Year | Tax Paid | Tax Assessment Tax Assessment Total Assessment is a certain percentage of the fair market value that is determined by local assessors to be the total taxable value of land and additions on the property. | Land | Improvement |
|---|---|---|---|---|
| 2025 | $4,231 | $30,660 | $5,059 | $25,601 |
| 2024 | $4,231 | $31,860 | $4,602 | $27,258 |
| 2023 | $4,058 | $20,206 | $4,707 | $15,499 |
| 2022 | $4,034 | $28,860 | $6,960 | $21,900 |
| 2021 | $4,142 | $28,920 | $6,960 | $21,960 |
| 2020 | $3,931 | $24,960 | $6,960 | $18,000 |
| 2019 | $1,836 | $21,720 | $6,960 | $14,760 |
| 2018 | $1,716 | $16,838 | $6,123 | $10,715 |
| 2017 | $3,432 | $16,838 | $6,446 | $10,392 |
| 2016 | $3,279 | $16,402 | $6,079 | $10,323 |
| 2015 | $2,808 | $15,475 | $4,376 | $11,099 |
| 2014 | $2,808 | $14,630 | $4,607 | $10,023 |
Source: Public Records
Map
Nearby Homes
- 36 Fillmore St
- 16 Van Buren St
- 24-26 York Ave
- 12 York Ave
- 77 York Ave
- 27 Eadie Place
- 203 York Ave
- 61 York Ave
- 135 Highview Ave
- 52 Park Place
- 180 Fillmore St
- 177 W Buchanan St Unit 79
- 350 Richmond Terrace Unit 7L
- 350 Richmond Terrace Unit 7P
- 350 Richmond Terrace Unit 1H
- 350 Richmond Terrace Unit 5J
- 350 Richmond Terrace Unit 7J
- 350 Richmond Terrace Unit 5H
- 63 Cassidy Place
- 190 W Buchanan St
- 30 Fillmore St
- 26 Fillmore St
- 34 Fillmore St
- 5 Highview Ave
- 38 Fillmore St
- 20 York Terrace
- 19 Highview Ave
- 26 Van Buren St
- 18 Van Buren St
- 15 Fillmore St
- 0 York Terrace
- 16 Fillmore St
- 30 Van Buren St
- 24 York Terrace
- 23 Highview Ave
- 48 Fillmore St
- 34 Van Buren St
- 34 Van Buren St Unit /32
- 14 Van Buren St
- 11 York Terrace