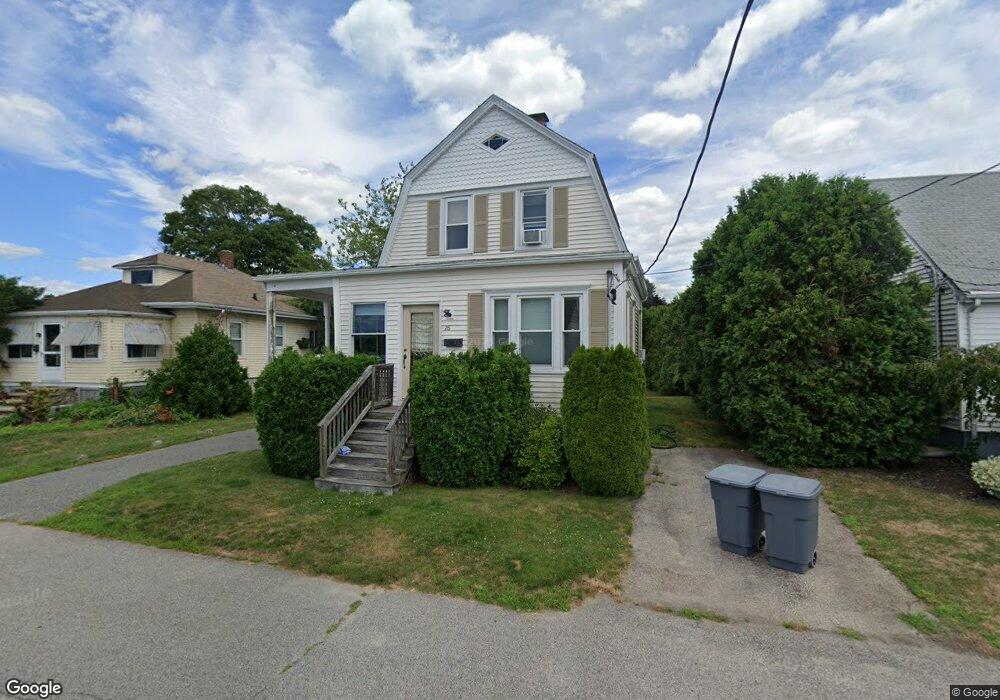
28 Gerald St Riverside, RI 02915
Outer East Bay NeighborhoodEstimated Value: $384,000 - $436,000
2
Beds
1
Bath
994
Sq Ft
$412/Sq Ft
Est. Value
About This Home
This home is located at 28 Gerald St, Riverside, RI 02915 and is currently estimated at $409,607, approximately $412 per square foot. 28 Gerald St is a home located in Providence County with nearby schools including East Providence High School, The Gordon School, and St Mary Academy-Bay View.
Ownership History
Date
Name
Owned For
Owner Type
Purchase Details
Closed on
Jun 18, 2007
Sold by
Lewis Michelle C
Bought by
Griffin Joshua and Griffin Teresa
Current Estimated Value
Home Financials for this Owner
Home Financials are based on the most recent Mortgage that was taken out on this home.
Original Mortgage
$218,000
Interest Rate
6.19%
Mortgage Type
Purchase Money Mortgage
Purchase Details
Closed on
Sep 28, 2006
Sold by
Hsbc Mtg Svcs
Bought by
Lewis Michelle C
Purchase Details
Closed on
Feb 22, 2006
Sold by
Hull Cynthia L
Bought by
Hsbc Mortgage Svcs
Purchase Details
Closed on
Jun 13, 1996
Sold by
Ivers Hope Elizabeth
Bought by
Hull Ronald S and Hull Cynthia
Create a Home Valuation Report for This Property
The Home Valuation Report is an in-depth analysis detailing your home's value as well as a comparison with similar homes in the area
Home Values in the Area
Average Home Value in this Area
Purchase History
| Date | Buyer | Sale Price | Title Company |
|---|---|---|---|
| Griffin Joshua | $218,000 | -- | |
| Lewis Michelle C | $189,000 | -- | |
| Hsbc Mortgage Svcs | $210,000 | -- | |
| Hull Ronald S | $79,000 | -- | |
| Griffin Joshua | $218,000 | -- | |
| Lewis Michelle C | $189,000 | -- | |
| Hsbc Mortgage Svcs | $210,000 | -- | |
| Hull Ronald S | $79,000 | -- |
Source: Public Records
Mortgage History
| Date | Status | Borrower | Loan Amount |
|---|---|---|---|
| Open | Hull Ronald S | $215,000 | |
| Closed | Hull Ronald S | $218,000 |
Source: Public Records
Tax History
| Year | Tax Paid | Tax Assessment Tax Assessment Total Assessment is a certain percentage of the fair market value that is determined by local assessors to be the total taxable value of land and additions on the property. | Land | Improvement |
|---|---|---|---|---|
| 2025 | $4,763 | $364,400 | $113,000 | $251,400 |
| 2024 | $4,665 | $304,300 | $94,100 | $210,200 |
| 2023 | $4,491 | $304,300 | $94,100 | $210,200 |
| 2022 | $4,212 | $192,700 | $57,500 | $135,200 |
| 2021 | $4,143 | $192,700 | $55,300 | $137,400 |
| 2020 | $3,968 | $192,700 | $55,300 | $137,400 |
| 2019 | $3,858 | $192,700 | $55,300 | $137,400 |
| 2018 | $3,711 | $162,200 | $48,400 | $113,800 |
| 2017 | $3,628 | $162,200 | $48,400 | $113,800 |
| 2016 | $3,611 | $162,200 | $48,400 | $113,800 |
| 2015 | $3,842 | $167,400 | $49,700 | $117,700 |
| 2014 | $3,842 | $167,400 | $49,700 | $117,700 |
Source: Public Records
Map
Nearby Homes
- 42 Mountain Ave
- 53 Wampanoag Trail
- 180 Grassmere Ave
- 14 Maxfield Ave
- 2941 Pawtucket Ave
- 34 Commack Rd
- 74 Brookhaven Dr
- 177 Dover Ave
- 77 Gardiner Ave
- 151 Dover Ave
- 378 Juniper St
- 25 Ingraham St
- 41 Follett St
- 58 Swan St
- 44 Charles St
- 170 Schuyler St
- 157 Grosvenor Ave
- 6 Fuller Ave
- 25 Bullocks Point Ave Unit 5C
- 33 Bullocks Point Ave Unit 5C
Your Personal Tour Guide
Ask me questions while you tour the home.